Here at Ably, we deal with hard engineering problems all the time and pushing at the edges often results in us running up against all sorts of interesting gotchas. We recently made some AWS NLBs fall over, and had a hazardous encounter with Cassandra counter columns.
In our day-to-day, we use gRPC for fast and efficient data exchange with mutual client/server state synchronization. It’s generally the right tool for the job, but we have come across some performance issues that left us scratching our heads.
Recently, we spent longer than planned trying to work out why the performance of a gRPC streaming server was worse than expected. Given how commonly used gRPC is, we expected lots of blog posts and Stack Overflow questions, but most of the performance analysis out there was focused on unary requests and not streams. So we rolled up our sleeves and went sleuthing in-house.

gRPC in brief
gRPC was developed by Google as an open source Remote Procedure Call (RPC) framework designed to connect services in and across data centers. It supports load balancing, tracing, health checking, and authentication. Due to its high-performance design and common language support, it has widespread use for connecting up microservices which is the thing we use it for. It is language agnostic and lightweight so is just as suited to connecting end devices to cloud servers. It uses HTTP2 as transport protocol and Protocol Buffers as the interface designation.
gRPC request models
gRPC has two types of request models:
- Unary – straightforward request-responses mapped on top of HTTP2 request-responses
- Streamed – multiple requests and responses get exchanged over a long-lived HTTP2 stream, which can be unidirectional or bidirectional
HTTP2 multiplexes streams over a long-lived TCP connection, so there is no TCP connection overhead for new requests. HTTP2 framing allows multiple gRPC messages to be sent in a single TCP packet.
For long-lived connections, streamed requests should have the best performance on a per-message basis. Unary requests require a new HTTP2 stream to be established for each request including additional header frames being sent over the wire. Once established, each new message sent on a streamed request only requires the data frame for the message to be sent over the connection.
System Under Test (SUT): gRPC streaming
After a lot of hard thinking and a fair bit of coding, we ended up creating the principal services to construct a new component of our message-processing pipeline. We wanted to performance-test the system to validate that what we’d done was going to be ample for the high throughput needs of Ably. Ably delivers billions of low latency messages to many millions of devices every day so performance is key to what we do.
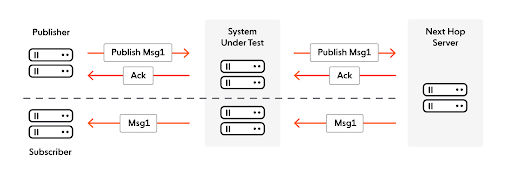
One of the services and the system under test (SUT) in this article is a gRPC streaming server written in Go. It principally serves two bidirectional stream RPCs: publish and subscribe streams. The SUT determines the correct next hop server for these streams and connects to it. Messages published by clients over a publish stream should then be available via a subscribe stream.
The messages are made up of a few small metadata fields (~100 bytes) and then a larger opaque data blob (can be multiple KB).

Publish Streams
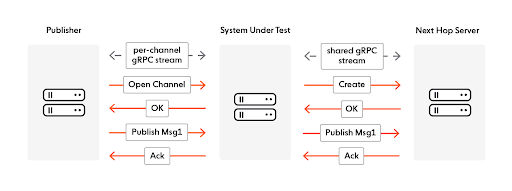
A client establishes a dedicated stream to the SUT to publish messages for an Ably channel. There is an initial request-and-response handshake that instantiates the channel in question. As part of this handshake the SUT determines the correct next server in the pipeline for the channel.
The client may then publish any number of requests. The SUT forwards the payload of those messages over a shared bidirectional gRPC stream to the next hop. Acknowledgements flow in the opposite direction but are trivially small.

Subscribe Streams
The flow on the subscribe side is very similar. The client creates a dedicated subscribe stream for an Ably channel to the SUT. The initial client request on this stream describes the channel being subscribed to. The SUT determines the location of the next hop server to satisfy that request and subscribes to it over a dedicated stream. The server then sends the desired messages to the SUT which then sends them to the client. Apart from the initial request establishing the subscription all further messages are server → SUT → client.

Performance Testing
We were principally interested in working out the per-message CPU and memory costs in this part of the pipeline.
The test had a number of load-generating instances which establish streams for publishing and subscribing. The load generators subsequently publish messages that transit the flows above. The system is configurable allowing:
- Number of publish streams
- Ratio of subscribe streams per publish stream
- Message publish rate
- Message payload size
All instances were running on m5.larges in the same AWS datacenter.
We were aware of a few suboptimal bits of the system but still had high hopes and expected a single instance to handle tens of thousands of messages/second without too much trouble.
Crushed hopes
For our first tests we used a 1:1 ratio of publishers to subscribers and a set number of 100 publishers and gradually ramped up the publish rate. This didn’t go so well:

At 1300 msg/s the CPU was already far higher than expected. The system was clearly not going to scale anywhere near the tens of thousands of messages per second that we needed for this development to meet its objectives.
What are all those cycles up to?
One of the best things about Go is its tooling. Getting a CPU profile is incredibly straightforward. So the first step in the investigation was to get a profile of the SUT.

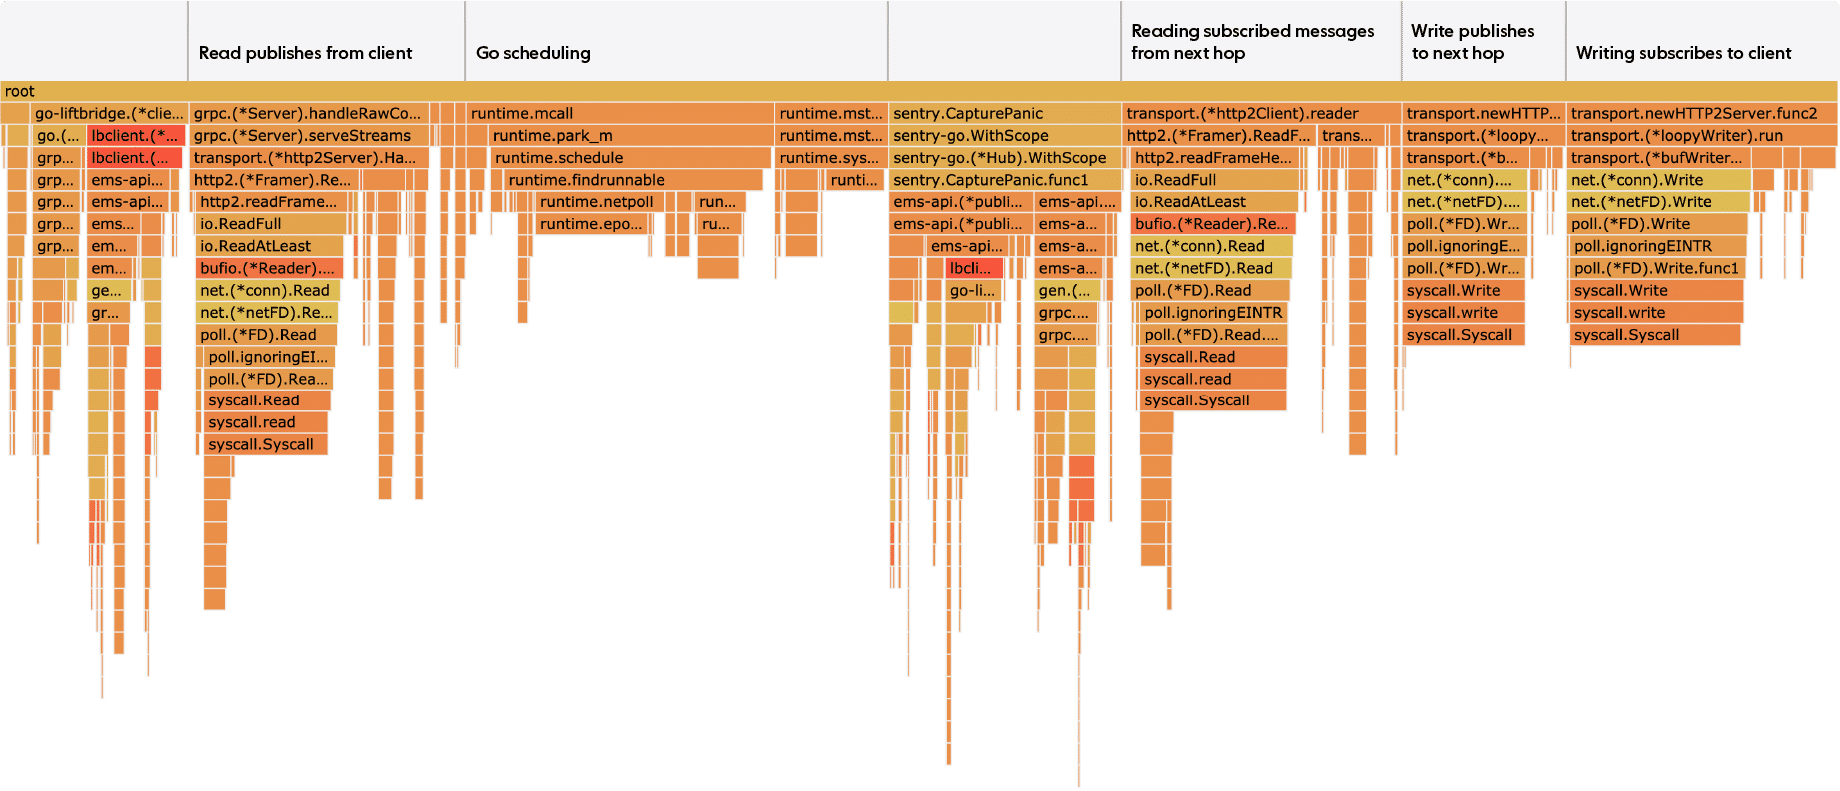
There are four large blocks in the flame graph for syscalls. One reads from the served publish streams, one writes to the client publish stream to the next-hop server, one reads from a client subscribe stream to the next-hop server, and lastly one writes to the served subscribe streams. Slightly more time is spent writing than reading.
We were expecting or maybe just hoping that there would be an obvious bug in our code. We definitely expected some impact from unmarshalling and marshalling the protobufs. In fact 27% of the CPU time is spent on the read and write syscalls. Waiting time does not show up in the flamegraph so the syscalls are actual CPU utilization. Scheduling goroutines seems to take up 17% of the CPU time and gRPC internals spend most of the rest. Our own code – that is, the application code that performs the processing of the messages themselves – barely seems to spend any time running.
Breaking down the CPU usage statistics from the performance tests also showed that typically almost half of the CPU usage was system (i.e. kernel) utilization.
At this point we were stumped. We can fix our code when it’s inefficient but what do we do when it’s not our code?
Simplify, simplify, simplify
There was a lot going on in this performance test which made it harder to find a root cause. Would we still see the same high syscall usage if we stripped back the test?
The load from subscribing was broadly the same as that from publishing. The network traffic just goes in the opposite direction. So we removed the subscribe load. The high CPU usage from the publish syscalls remained.
The next hop server was also seeing high CPU usage. We were worried that we’d found some performance issue on it that was somehow causing back-pressure issues to the SUT. So we made a new build of the SUT that skipped all onwards processing of published messages and instead just acknowledged and discarded them. The write syscall to the next hop server was gone but the significant CPU cost of the inbound read on the publish stream was still there, so it had nothing to do with the next hop server.
At the maximum sustainable message rate the system was generating only 30 MB/s of network traffic. We were able to see 300 MB/s bandwidth on the same network, so it was not a network bottleneck.
Could it just be gRPC?
At this point the thought crossed our minds that maybe this was just the performance of gRPC streams. It would be a surprise, but we couldn’t rule it out.
The gRPC benchmarking site wasn’t working, so we defined a simpler service definition and implemented a server for it.
//simpler service definition for benchmarking purposes
message Request {
    repeated Payload payloads = 1;
}
message Payload {
    bytes               key       = 1;
    bytes               value     = 2;
    map<string, bytes>  metadata  = 3;
}

message Response {
}

service Simple {
    rpc OpenStream (stream Request) returns (stream Response);
}
This service accepted streams of requests that contained opaque payloads and sent an empty acknowledgement for each request. It did nothing with the payloads. As with the SUT, requests and responses were pipelined, so there is no performance restriction from multiple requests being in flight on the same gRPC stream.
Running the same performance tests against the simple server showed significantly better performance for the same message rate.

For the same message rate and size the benchmark was spending much less CPU time in the kernel and reading the messages.
This was hard to make sense of. We did some further work to make sure the servers and clients use the same base container images and made a few more tweaks to the simplified service definition to make it closer to the real system. But nothing made any difference to the performance.
Packet capturing
The amount of data being processed on the server is the same, but is it really handling the same workload? The only way to tell is to get a packet capture of what the client is sending in each case.


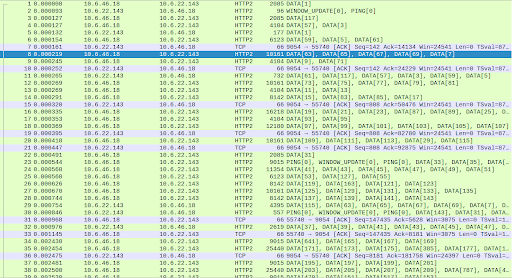
The packet captures immediately showed why the SUT server was having to work so hard. There was an order of magnitude more TCP packets when testing the SUT as compared with the benchmark. The server’s kernel had to process each packet separately and the HTTP2 server’s reads were also packet by packet and thus had to make more calls to the kernel.
The simple benchmark client managed to pack far more HTTP2 data frames into a single TCP packet than our SUT client even though the data frames are of a comparable size.
gRPC is subject to the flow control mechanisms of HTTP2 and TCP which could limit the size of the TCP packets or the number of data frames packed into the packets.
If TCP flow control was taking effect, ACKs would be advertising a 0 window size, but the window size remained consistent.
Similarly, HTTP2 has WINDOW_UPDATE frames which allow for per-stream flow control, but these also showed consistently large window sizes on both the stream and the connection.
So the smaller TCP packet sizes were not being forced by any flow mechanism. It had to be something the client was doing.
Timing is key
Looking to the start of the captures revealed the crucial difference between the two cases.
The SUT client creates each publisher in turn by creating a gRPC stream and sending a request to establish the parameters of the stream. It then waits for a response to agree that it was successful. The client subsequently creates a goroutine to start publishing messages on a timer and moves onto creating the next publisher.
The benchmark client creates each publisher by creating a gRPC stream and then a goroutine to periodically send a request to the server and wait for a response for that stream. The benchmark client skips the initial handshake request and response.
Creating a gRPC stream means sending an HTTP2 headers frame with the details of the new stream. A client doesn’t expect a response to these headers until a data frame has been sent.
This means the benchmark was able to create all of its streams at the same time and then schedule all of its goroutines so they are almost synchronized. With 1000 publishers, each sending a message every 200 ms, the timers were scheduled so that all messages were sent in the first 7 ms of the 200 ms window. It is hardly a surprise that the HTTP2 client was then able to pack the data frames for those requests into fewer writes to the TCP connection. As a result, far fewer packets were sent.
On the other hand, during the phase of publisher creation, the SUT client waits for a request to roundtrip the system before creating each goroutine, which means the publishers are scheduled closely together but with a roundtrip time between them. This explicitly forces a brief delay between the creation times of the publishers, and hence a delay between the publish times of their subsequent messages. As a result, the data frames do not get packed together.
To make matters worse, the data frames arriving separately at the server result in an increased number of PING frames being sent as well. The gRPC HTTP2 server will send a PING frame if a ping is not already in progress along with a WINDOW_UPDATE. When there are lots of data frames in flight at the same time, the PINGs will be backed up behind them, but here we see a PING sent for every data frame often in separate TCP packets resulting in twice the number of TCP packets sent.
So now we understand that we’re seeing two different patterns of publisher behavior, giving legitimate rise to substantially different outcomes. But which pattern is the more representative test? In fact, we don’t expect our clients to behave like either of these and don’t expect them to synchronize their messages in any way.
To create a representative test, we want no correlation between the publisher creating times. The solution to this is quite simple: add some random delay between creating each publisher. Rerunning both tests with this randomized delay brings the performance of the SUT and the benchmark into line. In fact, the resultant behavior is much closer to the original benchmark performance.
Lessons learned
Ably's enterprise-grade pub/sub messaging service is based on a globally-distributed, elastic and fault tolerant system. This architecture is key to achieving our foundational Four Pillars of Dependability.
The control plane for that distributed system is built on gRPC. Its easy stream multiplexing makes it the key fabric ensuring that all distributed operations across the system are synchronised between clients and servers; and protobufs’ straightforward data typing makes for efficient data handling between services.
It is excellent for those purposes.
However, there’s a flip side to the simplicity in that it hides what’s going on in the TCP connection. This becomes a problem at high message rates as you need to see what’s going on but gRPC does not make it easy. As such, it is hard to reason about and predict the network performance, causing at least a headache and potentially serious downstream consequences.
gRPC’s benefits still outweigh its drawbacks, there’s no denying that. However, this issue has raised some serious questions for us. For example, can we more efficiently pack our TCP packets while still keeping latency down? How do we monitor for problematic network loads? Can we catch this inefficient network behavior on the server and smooth it out? We don’t plan on re-architecting the system but are now much more aware of the bounds of what gRPC can offer.
Additionally, this investigation reinforced the need to always be aware of the actual costs of moving data and the underlying services that do that. We're accustomed to treating local network interactions as having negligible cost, given the massive bandwidth we get on AWS, but the fact remains that every layer does have a material cost, especially with small messages.
We continue to look at the work being performed in the gRPC/HTTP2 stack on a per-message basis, now much more aware of what gRPC can and cannot do in terms of sheer performance.
Latest from Ably Engineering
- Stretching a point: the economics of elastic infrastructure ?
- A multiplayer game room SDK with Ably and Kotlin coroutines ?
- Save your engineers' sleep: best practices for on-call processes
- Squid game: how we load-tested Ably’s Control API
- How to connect to Ably directly (and why you probably shouldn't) – Part 1
- Migrating from Node Redis to Ioredis: a slightly bumpy but faster road
- No, we don't use Kubernetes
About Ably

Ably is a fully managed Platform as a Service (PaaS) that offers fast, efficient message exchange and delivery and state synchronization. We solve hard engineering problems in the realtime sphere every day and revel in it. If you are running into problems trying to massively, predictably, securely scale your realtime messaging system, get in touch and we will help you deliver seamless realtime experiences to your customers.


