Kafka is often chosen as a solution for realtime data streaming because it is highly scalable, fault-tolerant, and can operate with low latency even under high load. This has made it popular for companies in the fan engagement space who need to transmit transactional with low latency (e.g. betting) to ensure that actions and responses happen quickly, maintaining the fluidity and immediacy of the experience. One of the easiest ways for companies to deliver data from Kafka to client devices is by using a Connector.
Kafka Connectors act as a bridge between event-driven and non-event-driven technologies and enable the streaming of data between systems - with ‘Sink Connectors’ taking on the responsibility of streaming data from topics in the Kafka Cluster to external systems. Connectors operate within Kafka Connect, which is a tool designed for the scalable and reliable streaming of data between Apache Kafka and other data systems.

Unfortunately, traditional approaches to scaling Kafka Connectors and managing extensive loads often prioritize throughput over latency. Considering the distributed nature of Kafka Connect, and a Connector’s dependency on external services, it’s a challenge to optimize end-to-end latency whilst maximizing throughput.
This means that where Kafka has been chosen for its low latency, benefits can be lost when Connectors are introduced. This is particularly problematic in fan engagement applications, and those using transactional data, because latency is critical to their success.
Solving for low latency with the Ably Kafka Connector
Having worked with businesses like NASCAR, Genius Sports, and Tennis Australia, the engineering teams at Ably understand the importance of low latency. So, to support companies looking to stream data between Kafka and end user devices, Ably developed its own Kafka Connector.
Recently, we conducted research to determine the optimal configuration for achieving minimal latency for a Kafka Connector, specifically under a moderate load scenario of between 1,000 and 2,500 messages per second. Let’s look at how we achieved this, and took on the challenge of measuring latency and finding bottlenecks.
Measuring latency and finding bottlenecks
Balancing latency and throughput is a complex task, as improving one often means sacrificing the other. The distributed nature of Kafka Connect and Connector’s dependency on external services make it challenging to understand the impact of your optimizations on end-to-end latency.
To address these challenges, we adopted a comprehensive approach using distributed tracing. Distributed tracing provides a detailed view of a request's journey through various services and components. This end-to-end visibility helps identify where latency is introduced and which components are contributing the most to the overall processing time.
We decided to use OpenTelemetry for distributed tracing. OpenTelemetry is an open-source observability framework that supports over 40 different observability and monitoring tools. It integrates smoothly with various languages and frameworks, both on the frontend and backend, making it an ideal choice for gaining visibility into the end-to-end flow of messages in our Kafka Connect environment.
How did we trace messages inside the Kafka Connector?
1. Instrumenting the load-testing tool
We began by patching our load-testing tool to include OpenTelemetry context in Kafka message headers. This modification allowed us to embed tracing information directly into each message, ensuring that the trace context was carried along with the message throughout its lifecycle.
Distributed tracing relies on context to correlate signals between different services. This context contains information that allows the sending and receiving services to associate one signal with another.
2. Enhancing the Kafka Connector
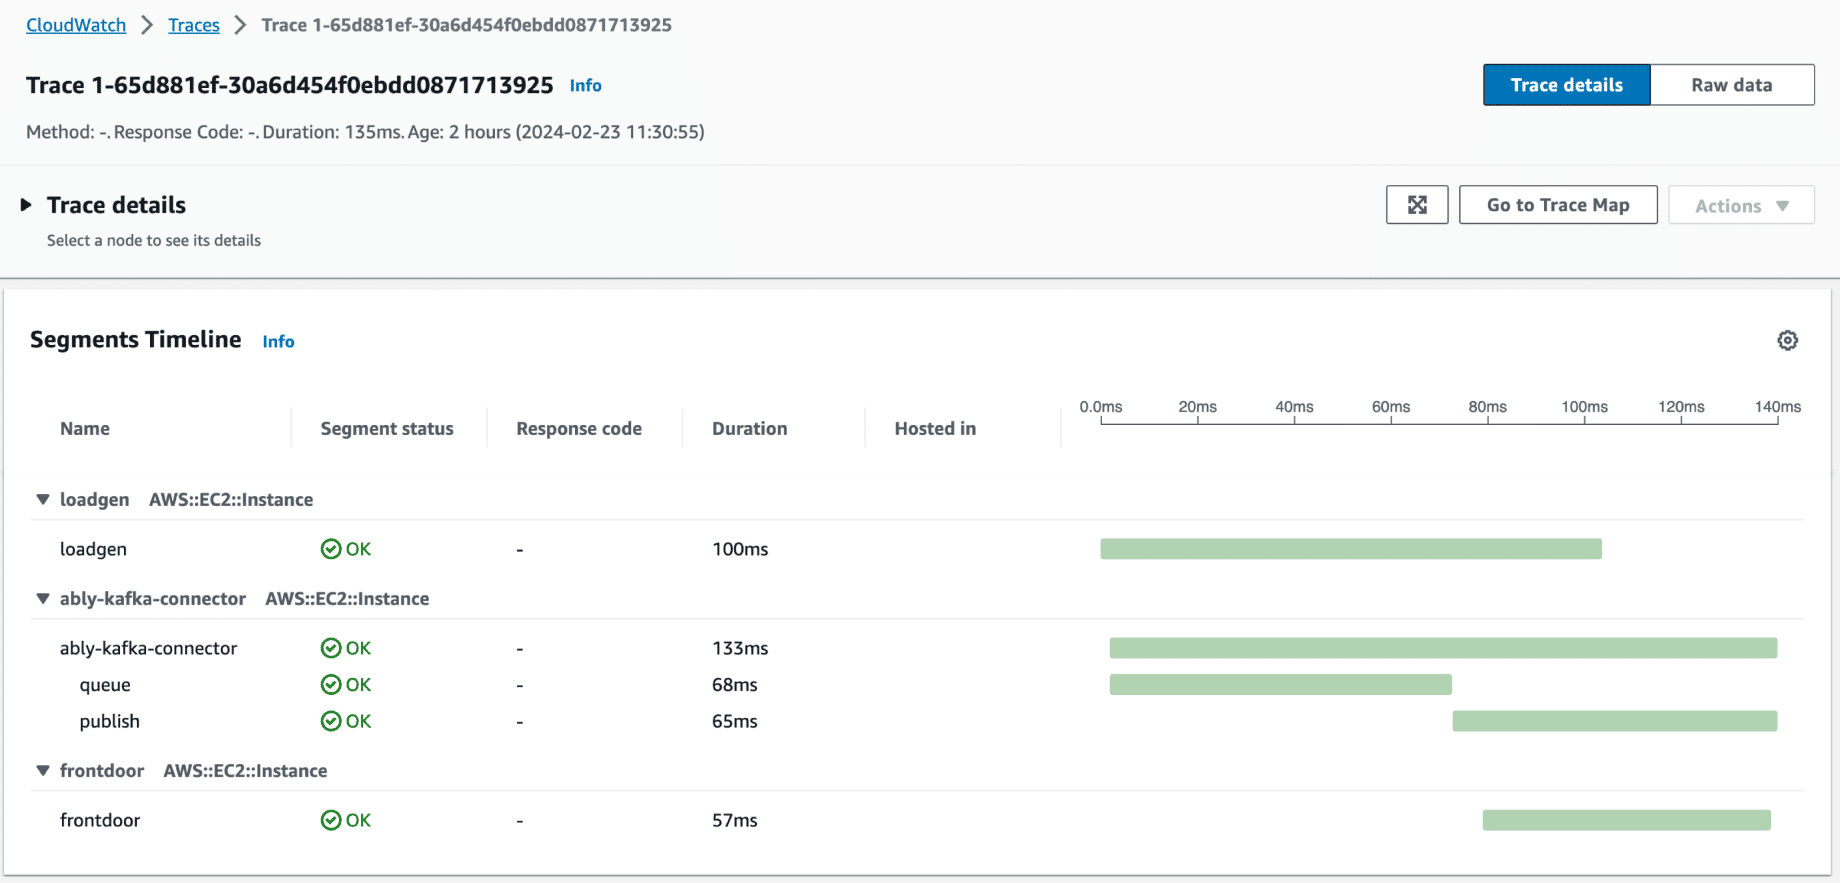
Next, we patched the Kafka connector to extract the OpenTelemetry context from the message headers. The connector was modified to send traces at key points: when a message was queued and when it was published. By instrumenting these stages, we could monitor and measure the time spent within the Kafka connector itself.
3. Measuring end-to-end latency
Finally, we extended our client application, which listens to the final Ably messages, to include tracing. By doing so, we could capture the complete end-to-end latency from the moment a message was produced until it was consumed. This comprehensive tracing setup allowed us to pinpoint latency bottlenecks and understand the impact of various optimizations on the overall performance.
4. Visualization
To visualize the telemetry data, we used Amazon CloudWatch, which integrates seamlessly with OpenTelemetry. This integration allowed us to collect, visualize, and analyze the traces and metrics with ease:

Although we couldn't find an existing OpenTelemetry library to inject and extract context directly into and from Kafka messages, it was easy to implement this functionality ourselves. We achieved this by implementing simple TextMapGetter and TextMapSetter interfaces in Java. This custom implementation allowed us to embed and retrieve the tracing context within the Kafka message headers, ensuring that the trace information was properly propagated through our system:
// Implement TextMapGetter to extract telemetry context from Kafka message
// headers

public static final TextMapGetter<SinkRecord> textMapGetter =
    new TextMapGetter<>() {
    @Override
    public String get(SinkRecord carrier, String key) {
        Header header = carrier.headers().lastWithName(key);
        if (header == null) {
            return null; }
        return String.valueOf(header.value());
    }
    @Override
    public Iterable<String> keys(SinkRecord carrier) {
        return StreamSupport.stream(carrier.headers().spliterator(), false)
            .map(Header::key)
            .collect(Collectors.toList());
    }
};
 // Implement TextMapSetter to inject telemetry context into Kafka message
// headers

public static final TextMapSetter<SinkRecord> textMapSetter =
    new TextMapSetter<>() {
    @Override
    public void set(SinkRecord record, String key, String value) {
        record.headers().remove(key).addString(key, value);
    }
};
Fine-tuning with built-in Kafka Connector configuration
With distributed tracing up and running, we were then ready to explore various methods to improve latency in Kafka Connectors.
Partitioning
One of the initial approaches we considered for reducing latency in Kafka was to increase the number of partitions. A topic partition is a fundamental unit of parallelism in Kafka. By distributing the load more evenly across multiple partitions, we anticipated that we could significantly reduce message processing times, leading to lower overall latency. However, during our research, we found out that our clients are not always able to increase the number of partitions due to their application logic constraints. Given these limitations, we decided to shift our focus to other optimization options.
Number of tasks
After deciding against increasing the number of partitions, we next focused on optimizing the tasks.max option in our Kafka Connector configuration. The tasks.max setting controls the maximum number of tasks that the connector can run concurrently. The tasks are essentially consumer threads that receive partitions to read from. Our hypothesis was that adjusting this parameter could help us achieve lower latency by running several tasks concurrently.
During our tests, we varied the tasks.max value and monitored the resulting latency. Interestingly, we found that the lowest latency was consistently achieved when using a single task. Running multiple tasks did not significantly improve, and in some cases even increased, the latency due to the overhead of managing concurrent processes and potential contention for resources. This outcome suggested that the process of sending data into the Ably was the primary factor influencing latency.
Message converters
In our pursuit of reducing latency, we decided to avoid using complicated converters with schema validation. While these converters ensure data consistency and integrity, they introduce significant overhead due to serialization and deserialization. Instead, we opted for the built-in string converter, which transfers data as text.
By using the string converter, we sent messages in JSON format directly to Ably. This approach proved to be highly efficient, since Ably natively supports JSON, and that minimized the overhead associated with serialization and deserialization.
Improving latency with Ably Connector solutions
After thoroughly exploring built-in Kafka Connector configurations to reduce latency, we turned our attention to optimizing the Kafka Connector itself. First we focused on the internal batching mechanism of the Ably Kafka Connector. Our goal was to reduce the number of requests sent to Ably, thereby improving performance.
Experimenting with batching intervals
We conducted experiments with different batching intervals, ranging from 0ms (no batching) to 100ms, using the batchExecutionMaxBufferSizeMs option. The objective was to find an optimal batching interval that could potentially reduce the request frequency without adversely affecting latency.
Our tests revealed that even small batching intervals, such as 20ms, increased latency in both the p50 and p99 percentiles across our scenarios. Specifically, we observed that:
- 0ms (no batching): This configuration yielded the lowest latency, as messages were sent individually without any delay.
- 20ms batching: Despite the minimal delay, there was a noticeable increase in latency, which impacted both the median (p50) and the higher percentile (p99) latencies.
- 100ms batching: The latency continued to increase significantly, reinforcing that batching was not beneficial for our use case.
These results indicated that for our specific requirements and testing scenarios, avoiding batching altogether was the most effective approach to maintaining low latency. By sending messages immediately without batching, we minimized the delay introduced by waiting for additional messages to accumulate.
Internal Connector parallelism
Next, we examined the internal thread pool of the Ably Kafka Connector. We observed that messages were often blocked, waiting for previous messages or batches to be sent to Ably. The Ably Kafka Connector has a special option to control thread pool size called batchExecutionThreadPoolSize. To address this, we dramatically increased the number of threads from 1 to 1,000 in our tests. This change significantly decreased latency, since it allowed more messages to be processed in parallel.
Trade-offs and challenges
However, this approach came with a trade-off: we could no longer guarantee message ordering when publish requests to Ably were executed in parallel. At Ably, we recognize the critical importance of maintaining message order in realtime data processing. Many applications rely on messages being processed in the correct sequence to function properly. Therefore, though it would increase latency, batchExecutionThreadPoolSize can be set to 1 to guarantee message ordering if absolutely required.
Future directions
Looking ahead, our focus is on developing solutions that increase parallelism without disrupting message order. We understand that maintaining the correct sequence of messages is crucial for various applications. We are actively exploring several strategies to overcome this limitation and will share our findings soon.
How our Ably Kafka Connector insights apply elsewhere
The insights and optimizations we explored are not limited to the Ably Kafka Connector; they can be applied broadly to any Kafka Connector to improve performance and reduce latency. Here are some general principles and strategies that can be universally beneficial:
Understanding and optimizing built-in Kafka configuration
1. Partitions and tasks management:
- Partitions: Carefully consider the number of partitions. While increasing partitions can enhance parallel processing, it can also introduce complexity and overhead.
- Tasks: Adjusting the tasks.max setting can help balance concurrency and resource utilization. Our research showed that using a single task minimized latency in our scenario, but this might vary depending on the specific use case.
2. Simple converters: Using simpler converters, such as the built-in String converter, can reduce the overhead associated with serialization and deserialization. This approach is particularly effective when the data format, like JSON, is natively supported by the target system.
Optimizing connector-specific settings
1. Batching mechanisms: While batching can reduce the number of requests sent to external systems, our findings indicate that even small batching intervals can increase latency. Evaluate the impact of batching on latency and throughput carefully.
2. Thread pool configuration: Increasing the number of threads in the connector’s internal thread pool can significantly reduce latency by allowing more messages to be processed in parallel. However, be mindful of the trade-offs, such as potential issues with message ordering.
Although these settings are specific to the Ably Kafka Connector, similar options often exist in other Kafka Sink Connectors. Adjusting batch sizes, thread pools, and other configuration parameters can be effective ways to optimize performance.
Conclusion
Based on our experiments with the Ably Kafka Connector, we have achieved remarkable processing latency metrics. With a moderate load of approximately 2,400 messages per second, the connector demonstrated a median (p50) processing latency of under 1.5 milliseconds and a 99th percentile (p99) latency of approximately 10 milliseconds. These figures specifically represent the processing time within the connector, from the moment a message is received to its publication to the Ably service.


