We’ve rebuilt the Ably dashboard to give developers clear, realtime visibility into how their applications behave.
This isn’t just a cosmetic refresh. It’s a shift from a configuration-first dashboard to a live observability surface. One that lets you see channels, connections, messages, and errors as they happen, debug issues instantly, and understand usage without stitching together logs and tooling.
Why we rebuilt the dashboard
The previous dashboard did a solid job in helping you manage your apps, API keys, and configurations. But it didn’t show what was actually happening inside your realtime system. When something broke or behaved unexpectedly, you were left piecing together clues from SDK logs, APIs, and external tools. There wasn’t a single place to answer operational questions like who’s connected right now, what’s happening on a particular channel, or whether a pattern of errors is brand new or recurring.
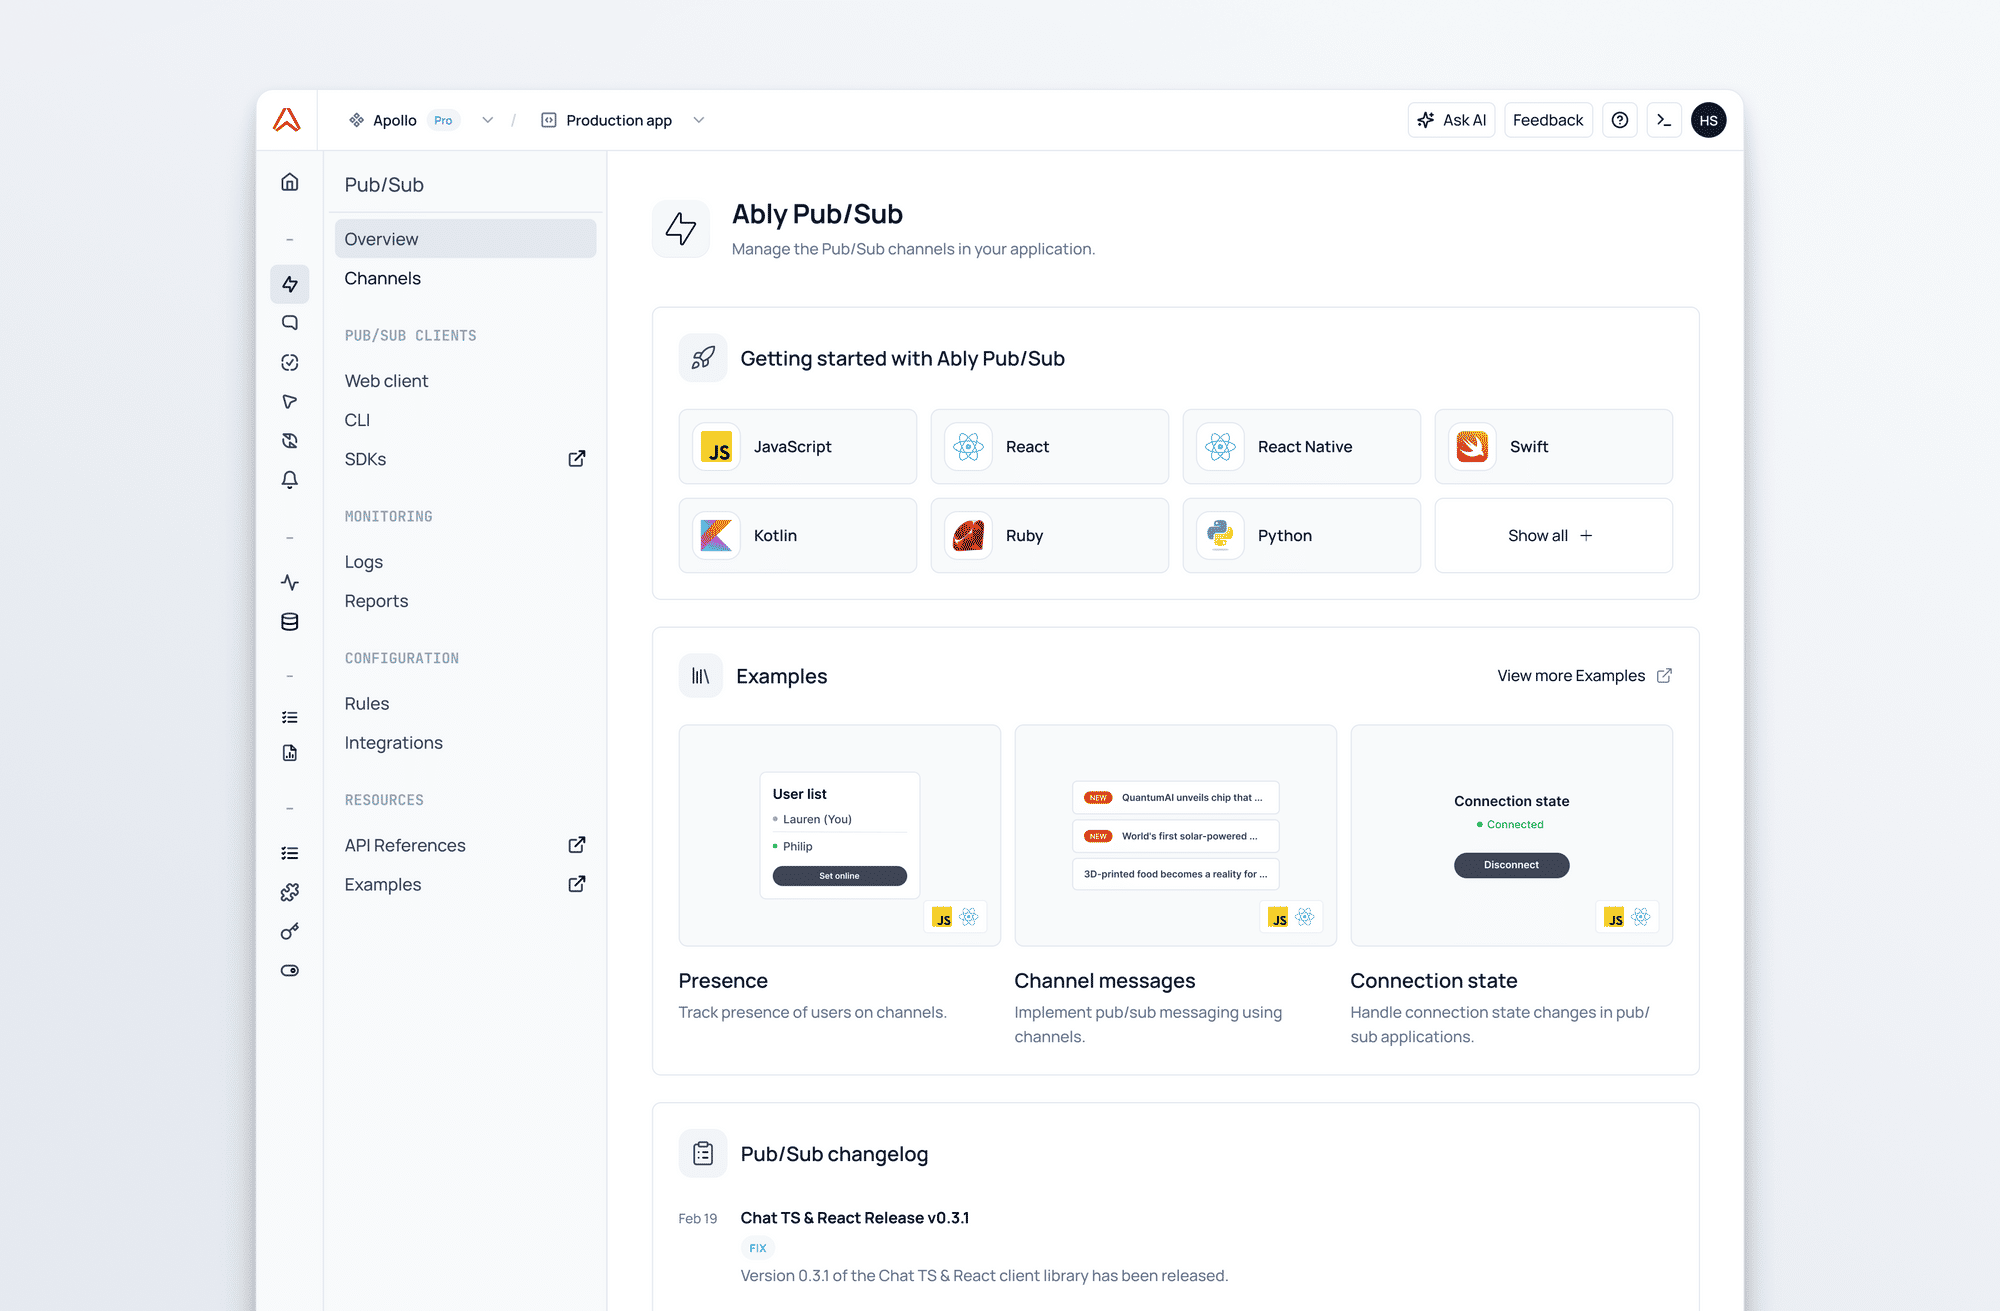
The new dashboard brings realtime observability directly into the browser. No setup, no extra tooling, no context switching - just a live window into Ably.
What’s new (and why it matters)
At the heart of this release are four capability upgrades that change how your team operates realtime systems on Ably. Each one is useful on its own; together, they make it far easier to understand behavior in your apps, debug faster, and understand what’s driving usage.
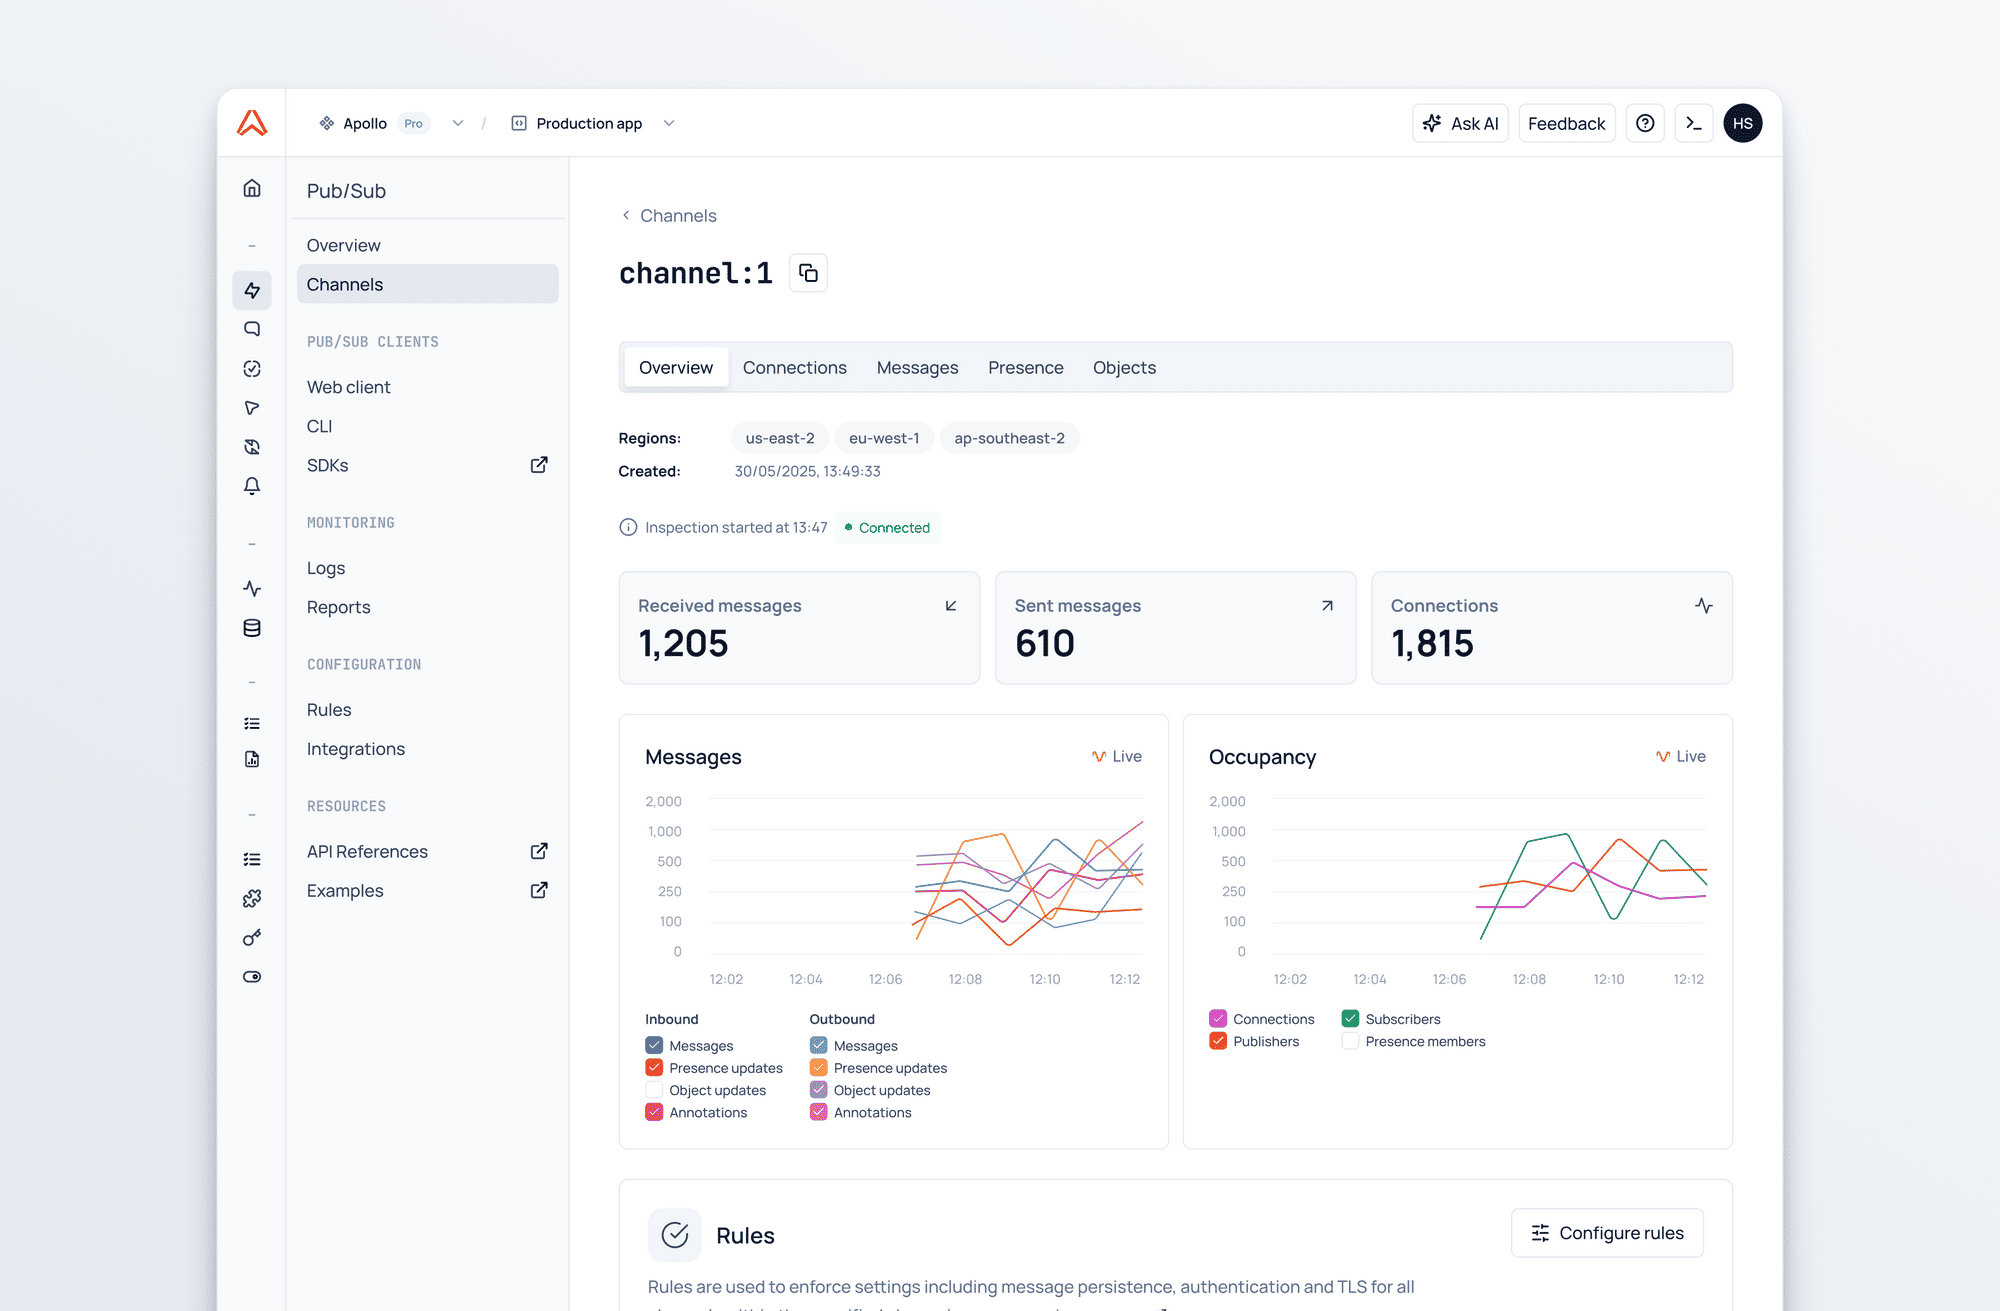
Channel and connection inspectors
The new inspectors provide realtime visibility into how your system behaves as data flows through Ably.
The channel inspector shows you who’s attached to the channel, which messages are being sent, and what’s happening in the presence set. You can also see which rules and integrations are active on that channel. Alongside that live activity, it surfaces realtime metrics like message rates, occupancy, and connection counts, so you can see performance as it changes - not after the fact.
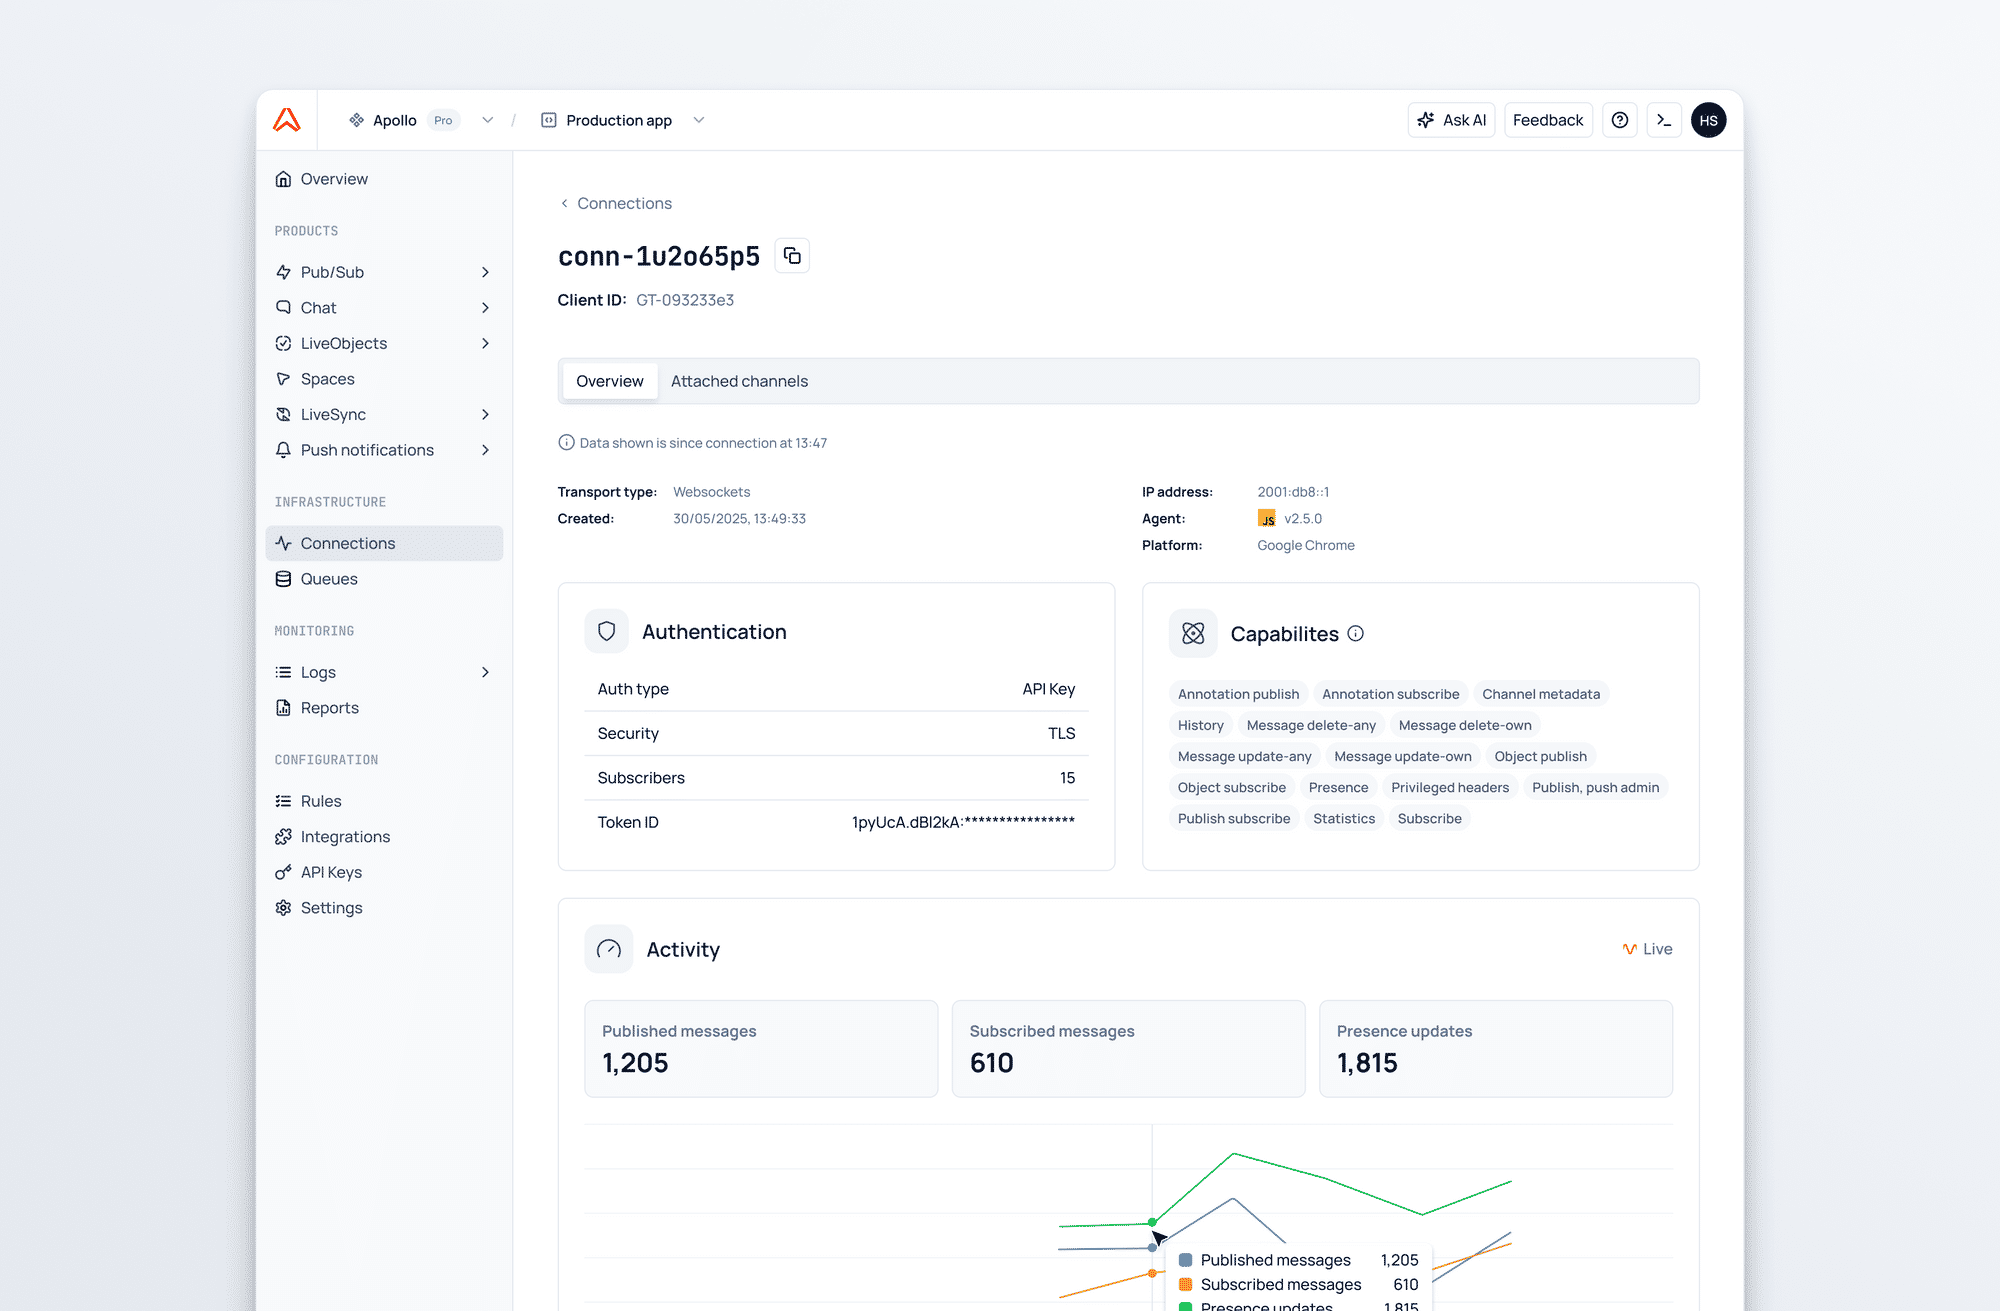
The connection inspector enables you to see who’s connected to your app. You can choose a specific connection and see which channels it’s attached to and view live statistics such as the rate of messages being published by that connection. Additionally, you can see information such as the geographical location of the connection and the SDK it’s connected to Ably with.Combined, the inspectors put realtime visibility into who’s interacting with your app, and which channels they’re interacting with. You now have the ability to debug any issues far more easily, such as ‘why is this channel still active?’
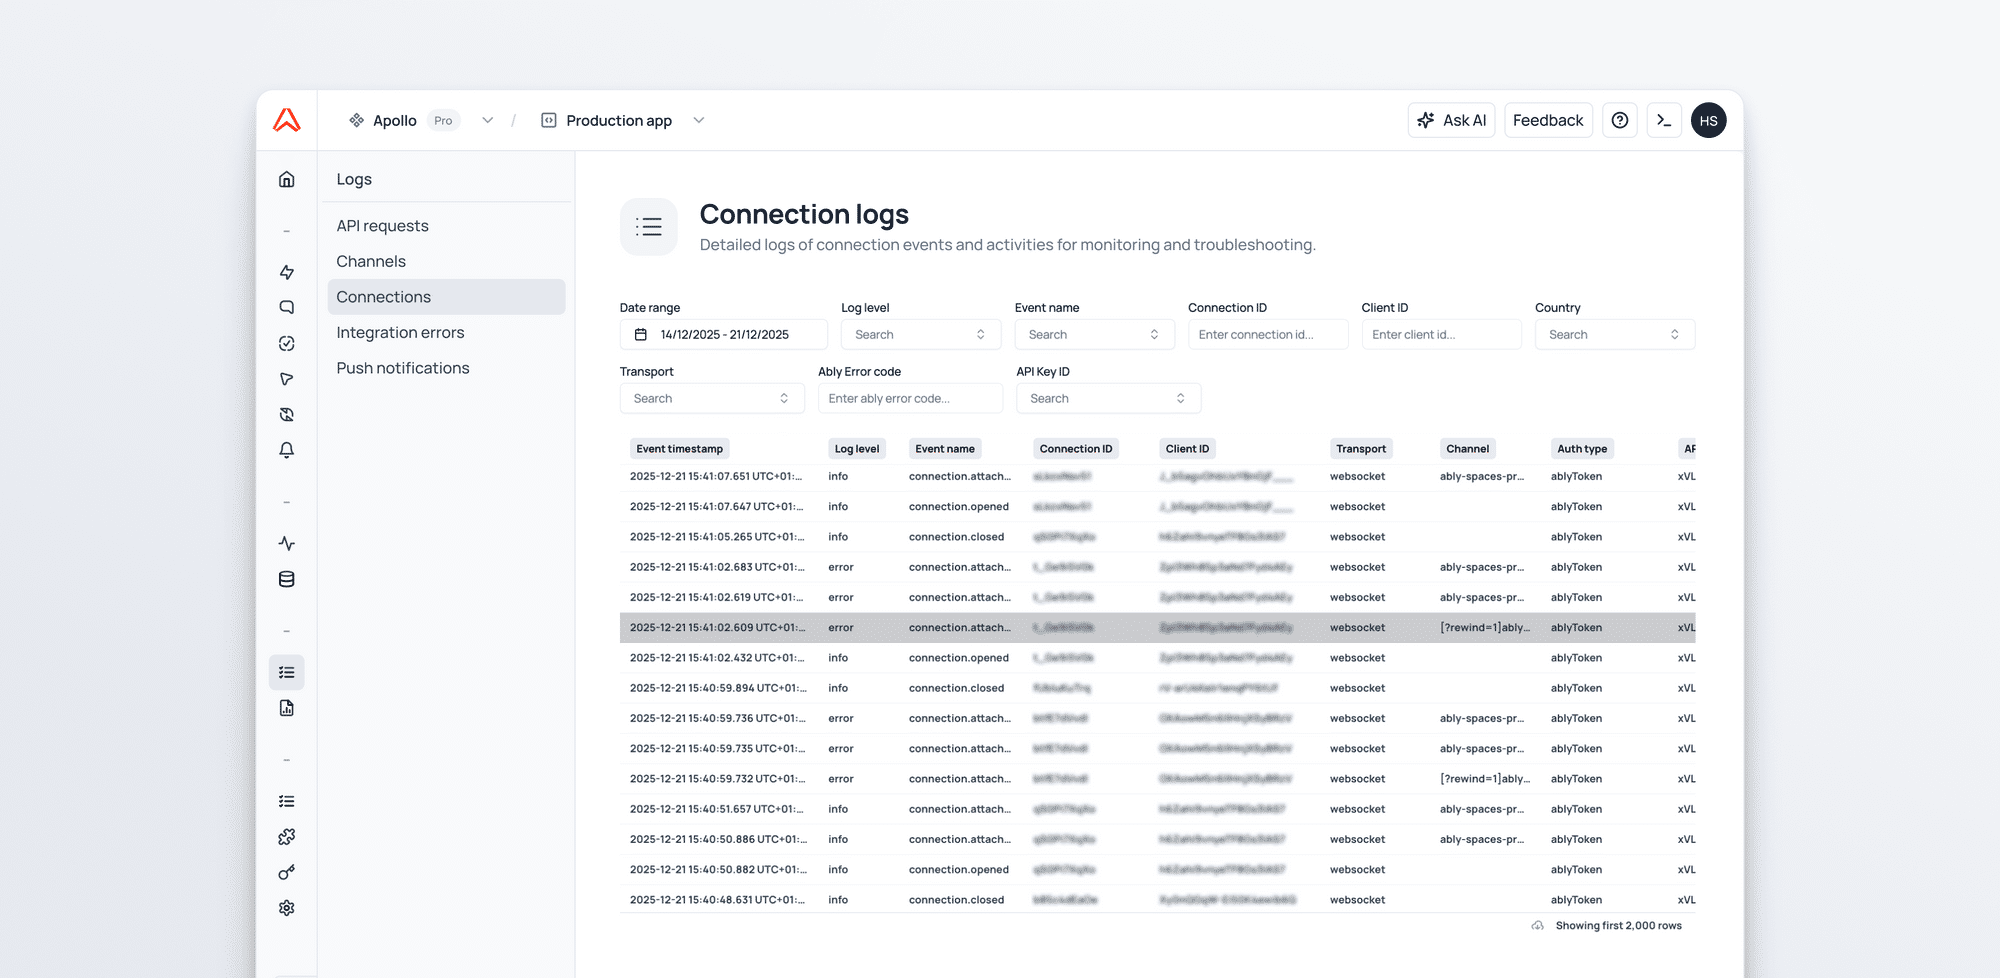
Log search
Live streams are great for what’s happening right now, but many investigations start with a timestamp. Log search lets you query historical platform events so you can understand past behavior, trace what happened and understand why it occurred. You can then compare today’s traffic with last week’s. It’s ideal for debugging anomalies and spotting patterns, especially when you’re trying to answer whether a problem is new or recurring.
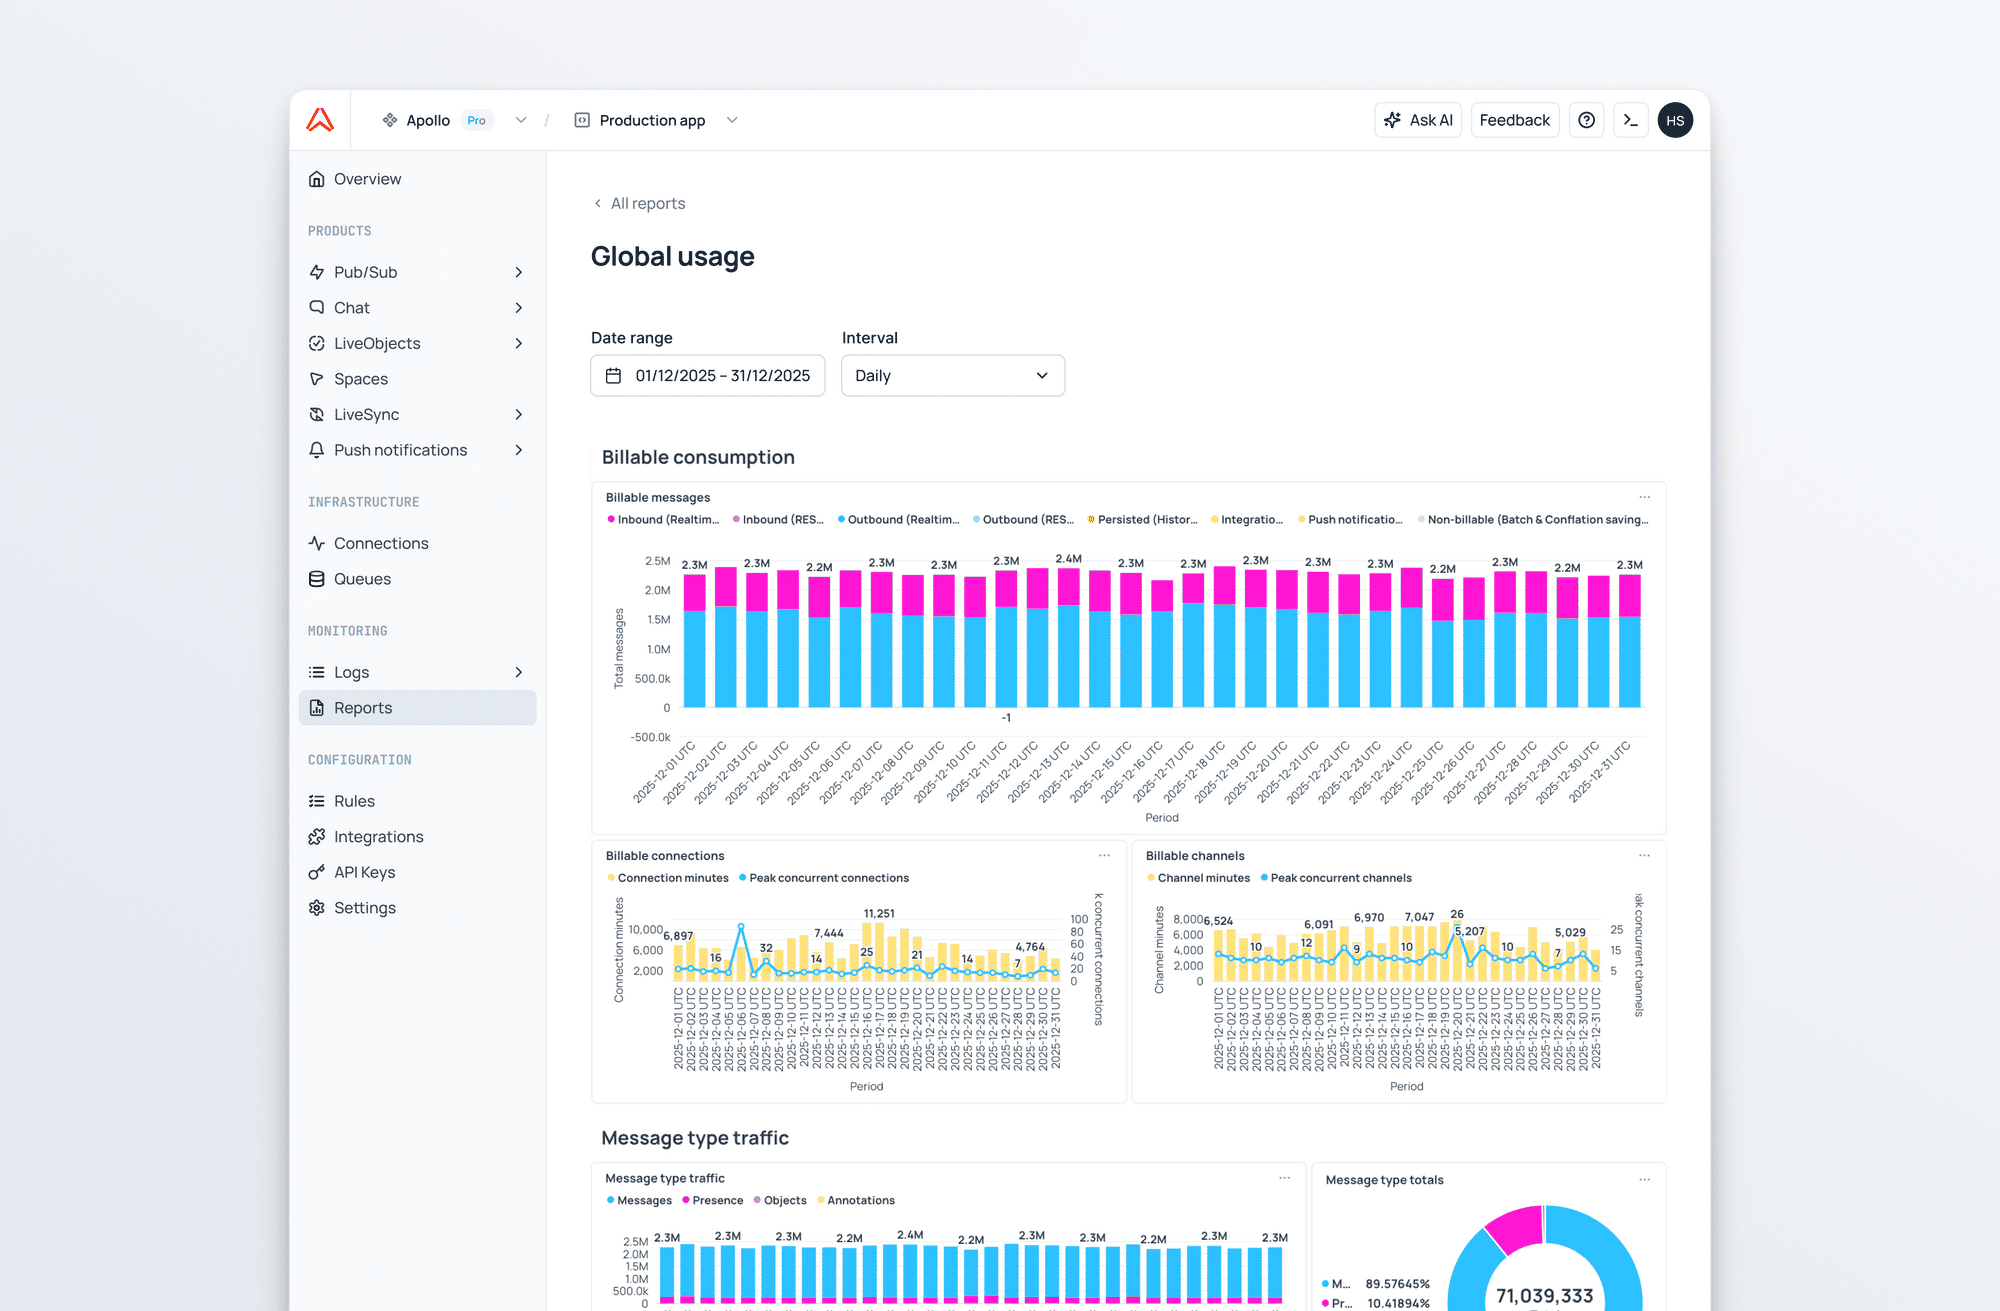
Reports and analytics
The new reports section gives you aggregated visibility into how your apps are used over time - message volumes, connection and channel durations - so you can understand where consumption is coming from and what’s driving traffic. This is particularly helpful when needing to explain usage internally, plan scaling work, or map realtime costs back to product features.
This is the foundation for deeper analytics arriving in future releases, including more granular breakdowns by product, SDK and device, plus finer‑grained views by app, channel, and namespace.
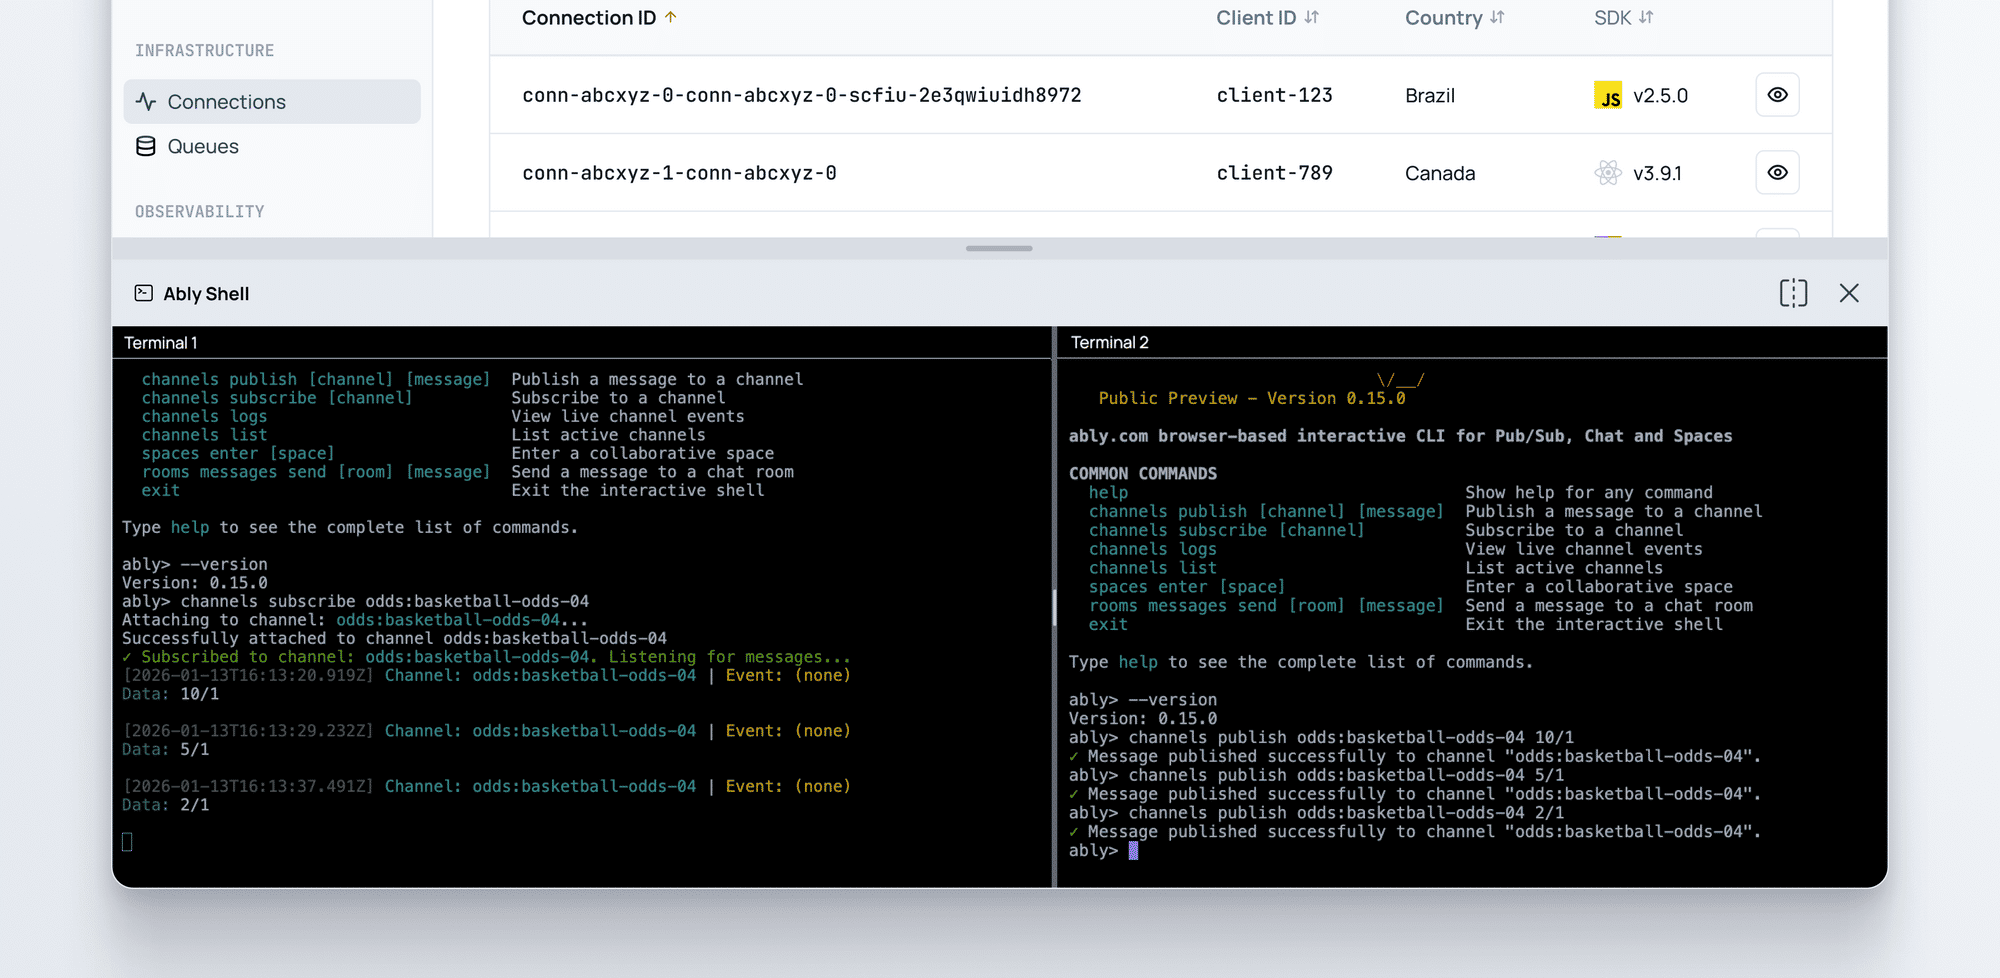
Web CLI
We’ve also introduced a new web CLI. A browser-based command line that lets you run Ably commands instantly. You can publish and subscribe to messages, enter presence, and manage your app configuration without any local setup. It complements the redesigned dashboard to give you a fast way to interact with Ably from anywhere. The web CLI is a powerful tool that’s invaluable for exploring Ably features without requiring you to write any code. It is especially useful during support calls where you need to quickly reproduce a certain behavior or send a specific set of messages.
Logs tail and live telemetry
Each inspector includes a live, realtime log stream scoped to the resource you’re viewing. If you’re inspecting a channel, you see the events relevant to that channel; if you’re inspecting a connection, you see the events relevant to that connection. This means you can trace behaviour as it happens, correlate spikes in live metrics with specific platform events, and debug instantly rather than collecting evidence after the incident.
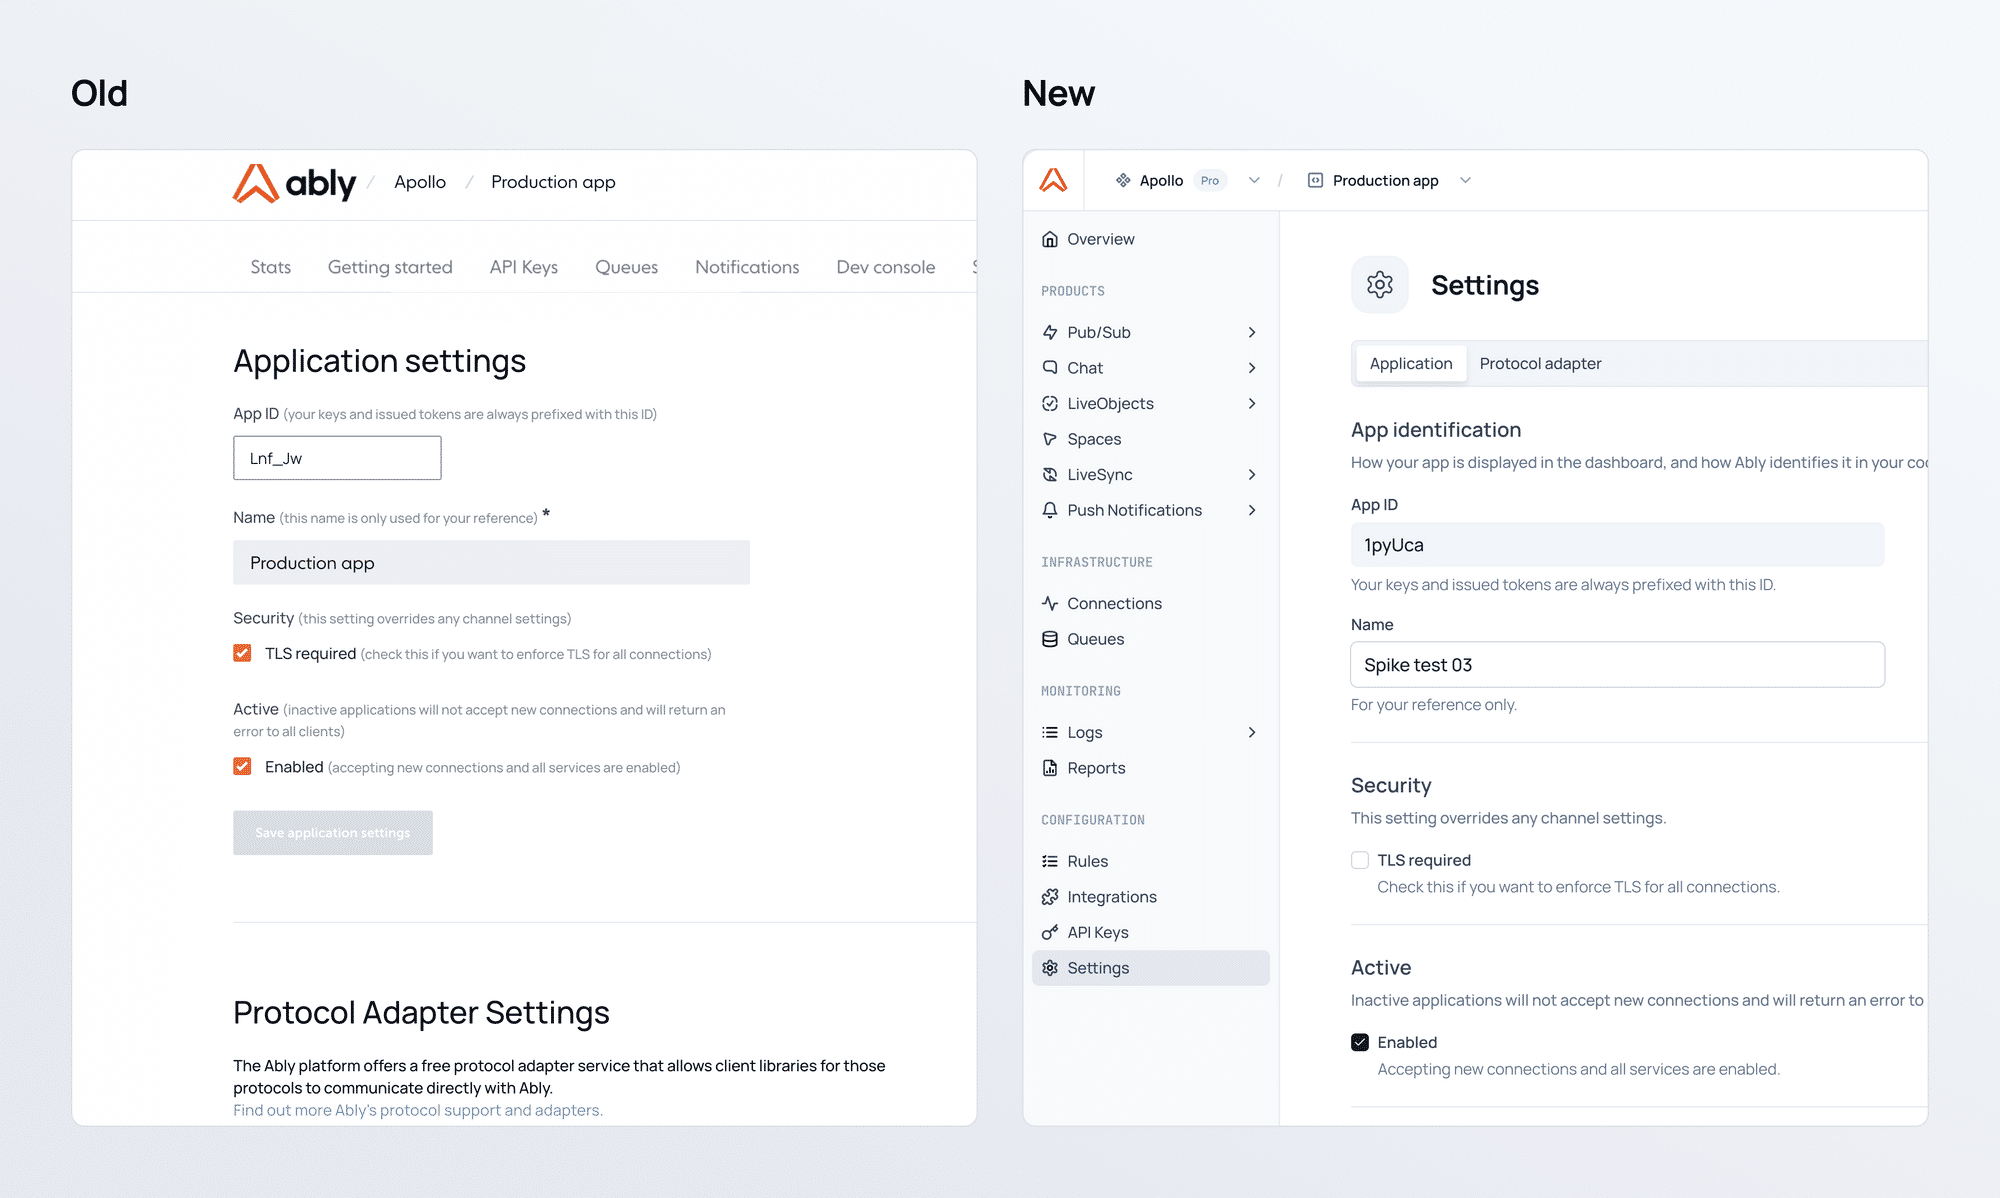
A more modern, product-first dashboard
Alongside these new capabilities, we’ve modernized the dashboard itself. Navigation is cleaner and faster, with dedicated sections for each Ably product. The result is a more intuitive experience that helps teams get to the right tools quicker; whether they’re debugging, trying out a new product, testing new features, or monitoring live traffic.
What’s coming next
This release is a major step toward making the dashboard a full observability layer for Ably. We’re working towards live logs: a global realtime stream of platform events across all resources to complement the existing log search functionality - so you can see what is happening live, and what has happened previously. We’re also continuing to expand the reports section to provide richer visualization of your usage, performance, and reliability, across all your apps.
In parallel, we’re continuing to modernize the remaining areas of the dashboard so that all your resources benefit from enhanced observability and analytics.