Many technology companies have an ongoing commitment to their customers to guarantee reliability and uptime, with service level agreements that guarantee to resolve or escalate incidents within a particular time frame.
Engineering team members rotate shifts so that someone is always on-call to be "paged" (these days, not using an actual pager) if an issue arises. Being on-call means that you typically need to be responsive even outside of your usual office hours. A system that regularly gets people out of bed makes engineers miserable and unproductive, which ultimately harms the quality of service provided to users.
As an infrastructure engineer, I've been on various on-call shift rotations in different companies (some have been better than others). The worst on-call rotation drove me to turn off PagerDuty notifications because they were too noisy, and instead forced me to dedicate myself to staring at dashboards.
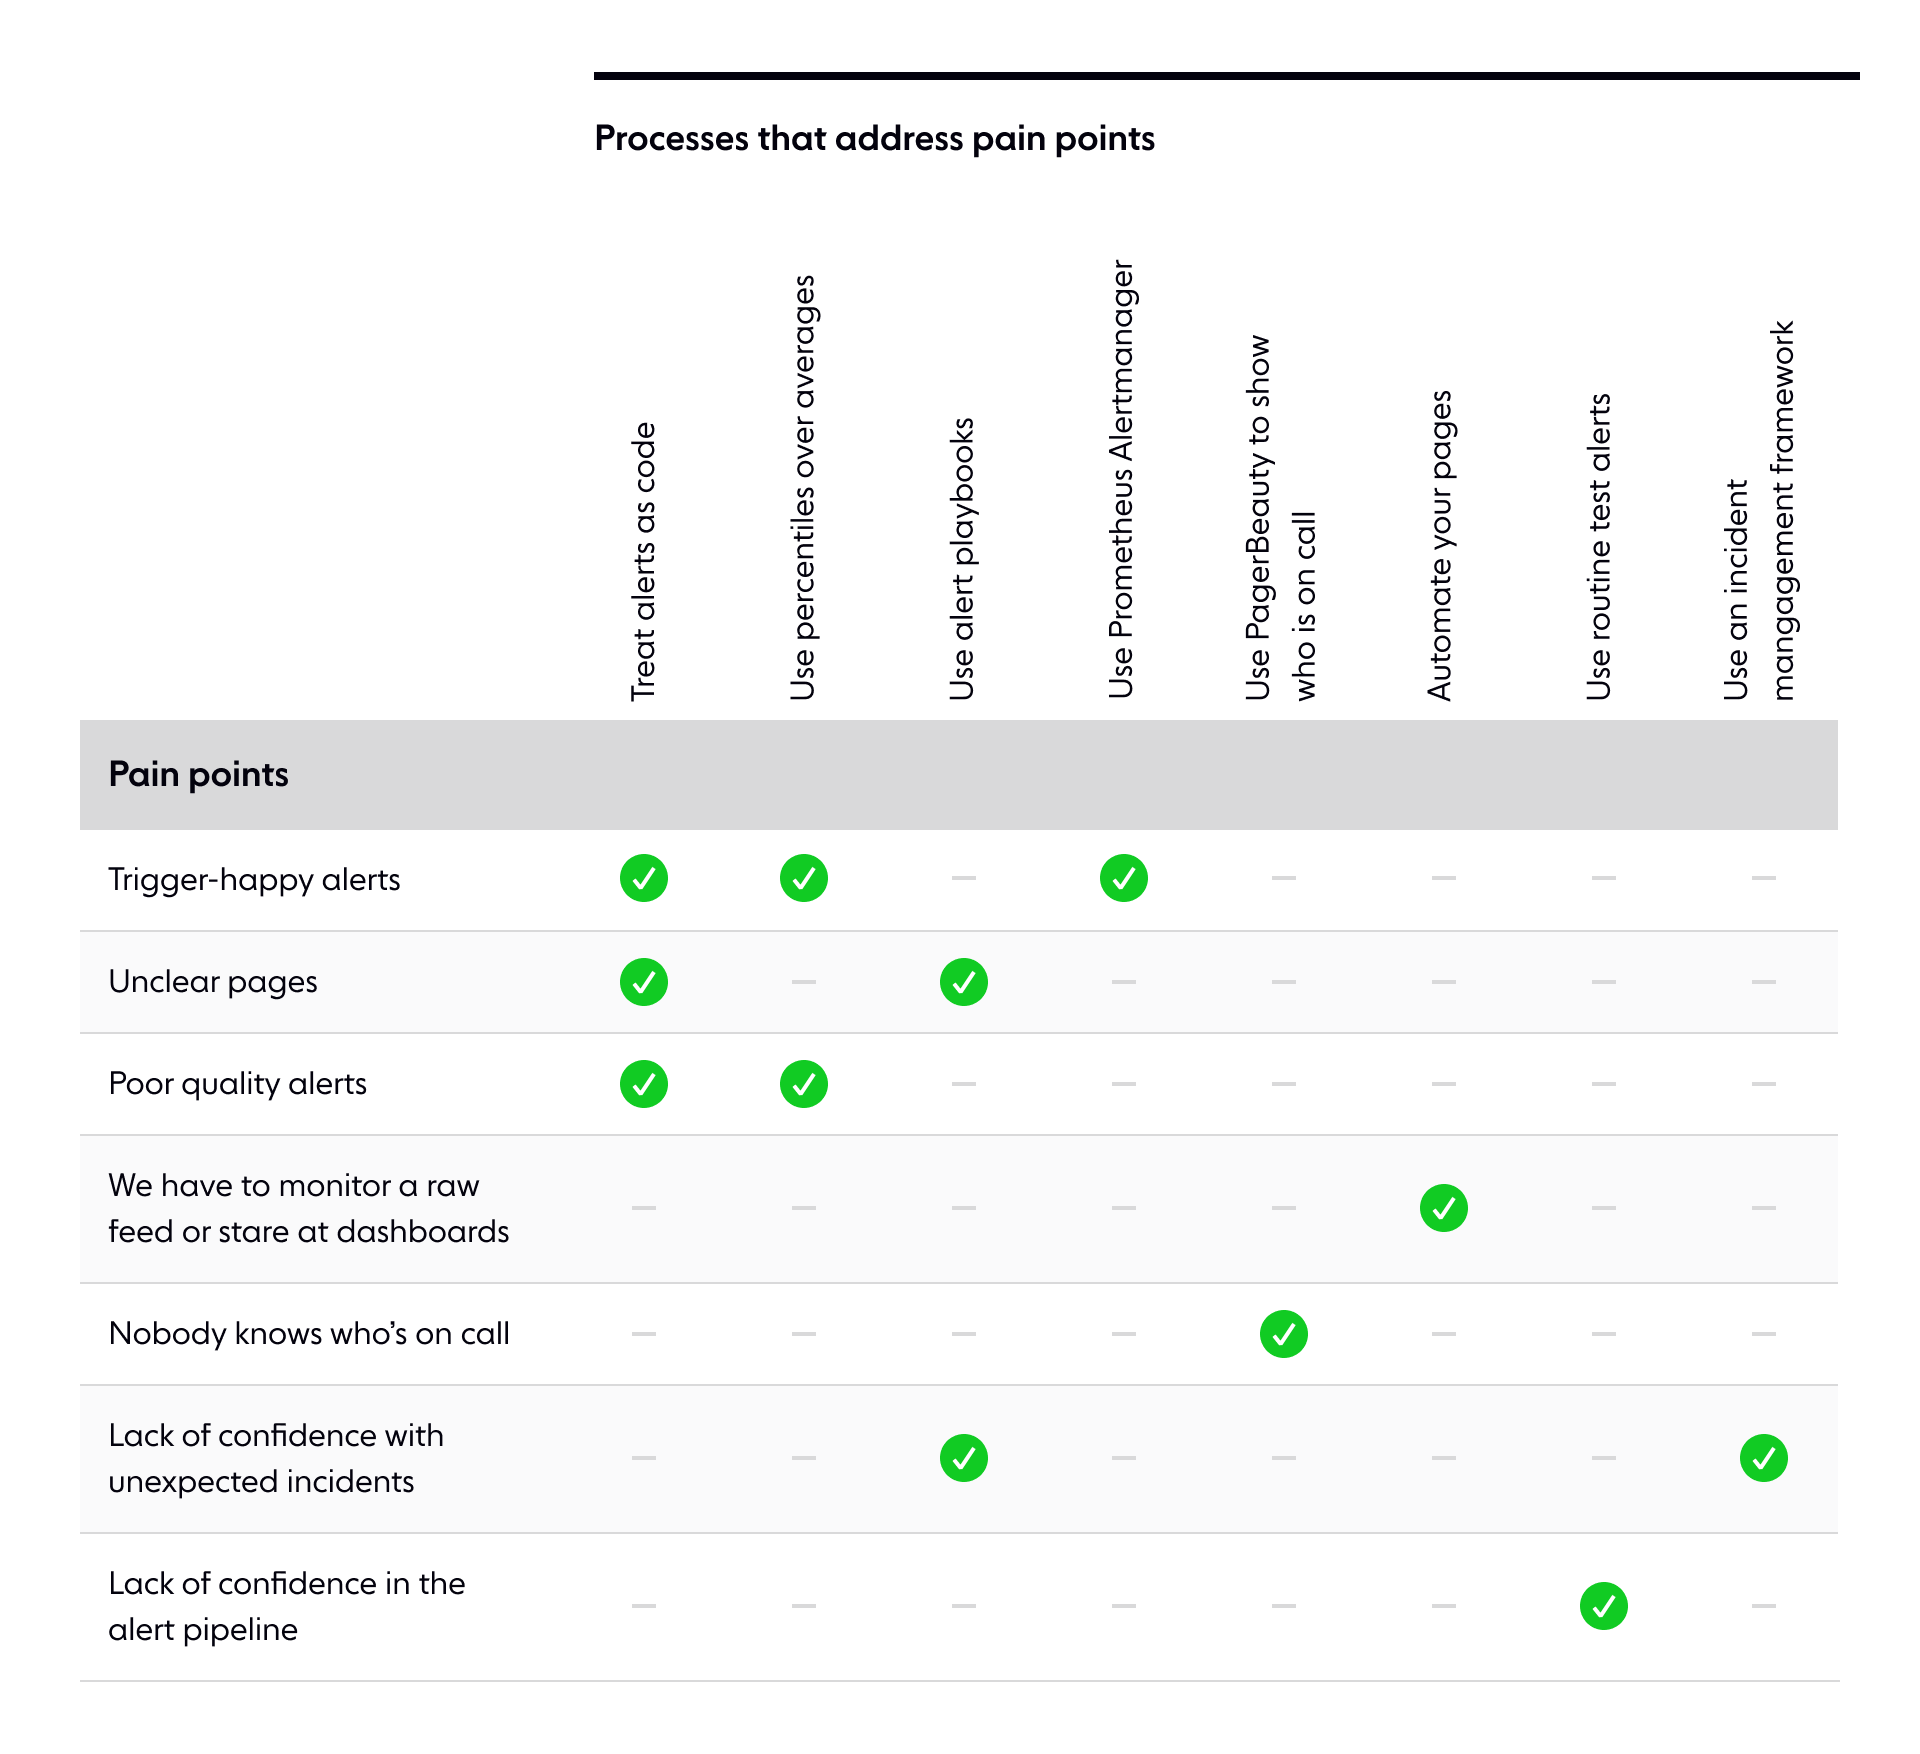
Here are some of the pain points I've identified as symptoms of a flawed alerting system. If you have experienced any of these, you may want to consider revamping your alert pipeline.
- Alerts are 'trigger happy' and page you when there is no issue.
- It's not clear why you're being paged nor what the page means.
- Alerts are of poor quality, and customers notice outages in the service before you do.
- You have to watch a raw feed of events (e.g., a Slack channel) or cycle through a set of dashboards to monitor the system effectively.
- Few others in the company know who is currently responsible for handling alerts, which makes it challenging to organize the incident response.
- The engineers on call don't feel confident in their ability to deal with unexpected incidents.
Discuss this post on HN
How to optimize your on-call process
In the rest of this post, I outline how we manage on-call shifts at Ably, including what we've built and how we've optimized processes to benefit the team, and our customers.
- We treat alerts as code
- We use percentiles over averages
- We use playbooks to document each alert
- We use Prometheus Alertmanager
- We use PagerBeauty to show who is on-call
- We automate all our pages
- We use routine tests
- We have an incident management framework
Treat alerts as code
We automate how alerts are set up and managed and treat them as we would code. Each new alert has to go through a code review before we deploy or modify it, which stops unsupervised changes and helps ensure quality.
We get the following benefits from considering alerts as equivalent to code:
- Alerts are consistent. For example, we enforce that an alert must link to any corresponding playbooks.
- Mistakes are centralized because alerts generate from the same set of common modules.
- New alerts are generated from existing modules. This makes it faster to create new alerts while previous bugs stay fixed as they benefit from previous bug fixes.
- Automation makes it easier to manage large numbers of alerts.
Types of alert
In general, the metrics you want to alert on will fall into three categories:
- Resource usage
- Latency
- Errors
I've had success provisioning Grafana alerts using a combination of Terraform and Grafonnet. Having alerts provisioned from the same underlying Terraform module helps tune alerts in a controlled way, and as we are going to run Grafana anyway, there's no need for additional services if we use it as the alerting engine too. It's easy to set up, and the user-friendly UI makes it easy to understand what alerts arise and why they are firing.
There are some disadvantages, such as Grafana lacking flexibility in setting alert thresholds, which have to be a static number and can't be another metric.
Non-production environments
We find that it's helpful to monitor non-production environments to further develop alerts without interfering with those on the live production system.
It's also useful to monitor how development environments behave during load testing and other development activities.
We keep development alerts separate to avoid any confusion as to whether an alert is in production or not.
Use percentiles over averages
Percentile-based queries should produce a higher quality signal for you to alert on.
Averages are not ideal because they are too simplistic and one-dimensional; they do not allow you to understand distributions. In contrast, percentiles enable you to understand distributions, and they are also configurable; you can choose what percentile you want to use. Some issues may be more visible at the tail end of the distribution - averages will miss this.
With a system of our size that runs thousands of instances, alerting based on a single instance is not feasible. We run so many instances, and it's reasonably likely that one might be having difficulty at any point in time. Instead, we monitor things in aggregate, using percentiles. We can do this because our system is fault-tolerant enough that an issue with a single instance doesn't affect customer service quality.
Use playbooks to document each alert
Every alert should have corresponding documentation that explains what is broken and how to investigate and fix it, with a suggested structure such as the following:
- High-level overview
- Severity
- Impact
- Debug suggestions
- Remediate actions
Any incidents that the alert creates should link to this documentation.
Documenting alerts means that new team members can onboard faster. It also means engineers can better support areas of the system with which they are less familiar. Lastly, it reduces the amount of independent thinking we have to do if we are paged at 3 AM - this is definitely a good thing.
Use Prometheus Alertmanager
Prometheus Alertmanager is a service that manages alerts. It can deduplicate and group alerts, as well as route them to different locations (PagerDuty, Slack, and so on).
In my experience, the most widely appreciated feature is the ability to silence specific alerts, for example, muting all alerts from a specific environment or AWS region: useful when you have upcoming maintenance or some other procedure that could cause alerts to fire unnecessarily.
This feature can also be misused. Every ops team sometimes ends up with a flaky alert that goes off even though there is no genuine issue, or the issue would have gone away without intervention. Appropriate responses to this might include:
- Removing the alert, if it is pretty clear the team will never actually care about this condition.
- Improving the alerting rule by raising thresholds or sampling over a larger time window to reduce false alarms.
- Stabilizing the underlying production system so that the minor issues detected stop happening.
But sometimes, the operator on shift sees a recurring false alarm and says, "I don't want to deal with this – I will just add a silence for this alerting rule that expires in 999 years".
Besides properly training operators and providing support and budgeting time for real fixes, this can be addressed with gentle enforcement by automatically removing unreasonably long silences.
I also appreciate how Alertmanager delays resolving incidents in PagerDuty for a short period, waiting to see if they arise again. This stops alerts from spamming you with extra pages about the same incident. Spammy alerts have been a source of frustration for our on-call engineers; incidents are stressful enough, even without your phone repeatedly going off.
Alertmanager allows you to create inhibition rules to suppress certain alerts if other alerts are already firing. This can reduce noise, but it adds complexity and can make it hard for an on-call engineer to work out why they have or haven't been paged. As such, use inhibition rules sparingly.
Karma
The standard Alertmanager UI is terrible. Karma fixes this.
Karma is a dashboard for AlertManager, providing you with a significantly improved UI for browsing alerts and managing silences.
I have found that Karma has improved visibility during incidents, making it easier for everyone to understand what is currently happening.
Anything that produces alerts should be sent to Alertmanager. This means your Karma dashboard will show the current state of all alerts. Having a single dashboard has been extremely helpful.
If your alert provider doesn't support Alertmanager, it's easy to integrate your own client.
Use PagerBeauty to show who is on-call
Communicating who is on-call is vital, as the company needs to know who is currently responsible for any incidents.
PagerBeauty is an excellent tool if you use PagerDuty. I recommend that you build a small webpage that uses PagerBeauty to show who is on-call for all of your on-call rotations.
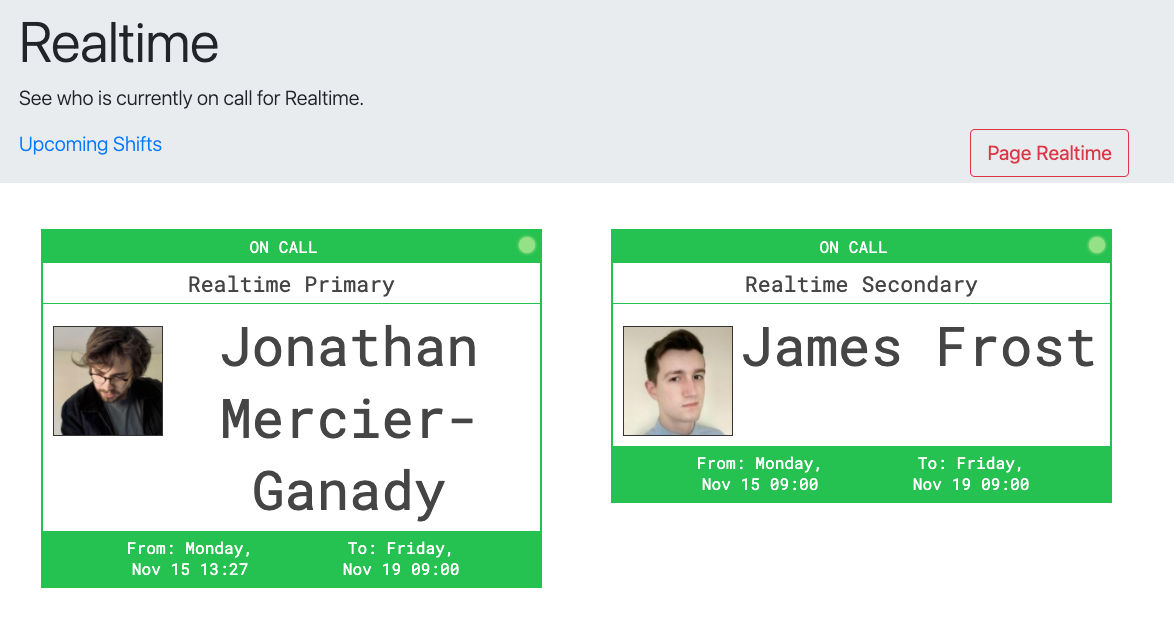
In addition, you could extend this webpage to show upcoming on-call schedules, as the PagerDuty UI for this is not great.
Automate all your pages
We do not expect on-call engineers to watch a Slack channel for events or regularly refresh dashboards. If we cannot confidently rely on alerts to catch every issue, there is a problem. (The only expectation we have is that our on-call engineer responds if they are paged).
Use routine tests
Here at Ably, whenever an engineer comes on-call, they receive an automated test page. The purpose of this page is to make sure that the alert pipeline works and that we can receive pages.
This has benefited me in the past when a recent Android update had broken the PagerDuty app's notifications. When I missed the routine test page, I knew there was a problem. Without that test, and the workaround I put in place, I would have missed an incident later that night.
Use an incident management framework
We have a clearly defined process for how we handle incidents. The framework defines when and how to declare an incident, as well as several different roles that need to be filled, ranging from note-taker to communications officer.
The objective of the incident management framework is for team members to be more organized and confident when responding to incidents:
- We are less likely to make mistakes as every action is peer-reviewed.
- We are less likely to forget any cleanup actions, as everything is documented.
- We are able to better organize incident post-mortems and remedial actions.
Final thoughts
I am regularly on-call, and I cannot emphasize strongly enough that you need a solid process and attention to detail. Not only does it simplify my job, but I'm confident that I am not going to be wrenched out of a deep sleep to deal with an unnecessary page, or to troubleshoot an issue without documentation.
Besides the obvious improvement to employee morale, a well-managed on-call rotation offers significant advantages to customers. A process that ensures data and documentation are in place to enable a swift response means you can identify and fix an issue efficiently. We also have more time to spend on other things that add value to the service rather than fight fires.
Here are a few articles about this topic for further reading:
- Learning by fixing — the value of triage engineer rotations
- How Can You Tell If Your On-Call System Is Broken?
- 6 Ways to Improve Your Monitoring and Incident Response
Latest from Ably Engineering
- Stretching a point: the economics of elastic infrastructure ?
- Key choices in AWS network design: VPC peering vs Transit Gateway and beyond
- Squid game: how we load-tested Ably’s Control API
- No, we don't use Kubernetes
About Ably
Ably is a fully managed Platform as a Service (PaaS) that offers fast, efficient message exchange and delivery, and state synchronization. It is built for massive scale and designed to ensure predictably low latencies (<65 ms global average). Our system has sufficient redundancy at regional and global levels to guarantee continuity of service even in the face of multiple infrastructure failures. Our fault-tolerant design enables us to provide legitimate 99.999% uptime SLAs.
If you are running into problems trying to massively, dependably, securely scale your distributed realtime communication system, contact our experts and see what Ably can do for you.